The EUR/USD slipped back above 1.3000 as a USD/JPY dip had the greenback on the defensive. On Tuesday morning, we turned to the German ZEW for direction.
Japanese bonds had yet another rock session, with the previous night’s show of strength late in the session unable to carry through. The 10-year yield is still a paltry 85 bps, but has crossed to a new high for the year. Again, it’s not about the size of the yield, but the velocity of the move, which is several standard deviations beyond what is normal due to the advent of Kuroda’s Big Move. The 2011 high in 10-year yields, for perspective, was over 135 bps. JPY crosses seemed to absorb the news well, and not as an impetus to engage in any panic selling - a novel dynamic and one to follow. 5-year yields close at almost 40 bps and above their 2012 highs.
In Europe, rescue funds are headed to Greece and Cyprus, but peripheral spreads have been easing a bit wider over the last couple of weeks – although directionally, we have all bonds across Europe selling off. It’s interesting that this is happening when everyone is beginning to talk up the risk of lower inflation.
Looking ahead
Sweden releases inflation data Tuesday morning - particularly weak data could weigh on the SEK, as the Riksbank still has a bit of policy room to move with its 1.00% rate. Core inflation is skimming along. It is just below 1.00% year-on-year over the last 12 months and a weak European economy, The stagnating housing bubble in Sweden and lower oil prices could begin to drag inflation even lower.
Technical observations
EUR/USD - 1.3000 is the obvious focus, but we’ve all gotten used to the criss-crossing by now, as the 200-day moving average and 55-day moving averages are also converging on this level. Stronger resistance up in the 1.3030/50 zone. If we get a close up through there, then we’ll have to abandon the tactical negative view. Otherwise, looking for confirmation of downside break with a close through those sub-1.2950 lows.
USD/JPY - the rally is looking a bit wobbly as we tested through the 101.35 daily pivot, but there’s room for consolidation back toward 100.80 or so without causing bulls too much consternation. The important upside resistance lies in the 102.20/50 zone. 100.00 is the line in the sand – massive correction potential if this support doesn’t hold.
GBP/USD – confirmed the crumbling of the channel formation – a reminder that all beautiful technical formations are made to be broken. Resistance is in at overnight 1.5332 highs and then up toward 1.5400. The downside looks open for a 1.5250/00 test and eventual 1.5000.
EUR/GBP – a break is a break, as local resistance gave way – but this was a break of a European cross in the Asian session, so I question the quality. If we dive back into the range, would look for the GBP to outperform the EUR back toward the lower end of the range around 0.8400. If the pair trades above 0.8500 in Europe, watch the descending line of consolidation for a possible break and upside momentum to develop.
USD/CHF - looking at the 0.9550/00 area for support to come in as we gear up for a rally to parity.
EUR/CHF - still looking for traction after an order in consolidation with the key supports at 1.2400 and then back toward 1.2350. Next key objective is 1.2500 and upside is preferred, though I’m curious what this pair does once the DAX decides it’s not quite going to make into outer space on this rally.
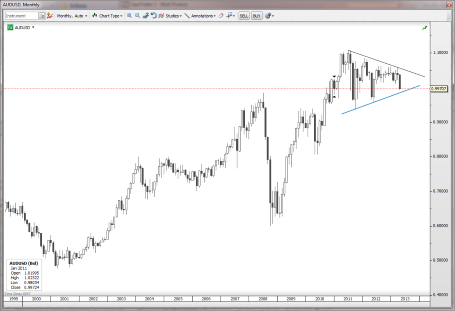
AUD/USD - parity is the obvious resistance, with 1.0100/20 a more robust resistance area if a consolidation sets in. In the big picture, the break of the old range has opened up the downside. Note the massive line of consolidation in the giant triangle to end all triangles in the chart below – a break and we’re talking about levels like 0.8500, or even 0.8000. AUD/USD" title="AUD/USD" width="455" height="311">
USD/CAD - Still looking for support to come in. If 1.0080/90 slips, then we may dip toward the 1.0065 ideal support. More importantly, a rally through 1.0130/50 confirms the neutralization of the downside risk. Prefer upside.
Economic Data Highlights
- New Zealand Q1 Retail Sales ex Inflation out at +0.5% QoQ vs. +0.8% expected and vs. +1.9% in Q4
- UK Apr. RICS House Price Index out at +1% vs. +2% expected and vs. -2% in Mar.
- Japan Apr. Domestic CGPI out at +0.3% MoM and 0.0% YoY vs. +0.1%/-0.2% expected, respectively and vs. -0.5% YoY in Mar.
- Sweden Apr. CPI (0730)
- Euro Zone Industrial Production (0900)
- Euro Zone May ZEW Survey (0900)
- Germany May ZEW Survey (0900)
- US Apr. NFIB Small Business Optimism (1130)
- Japan Apr. Consumer Confidence (0500)
