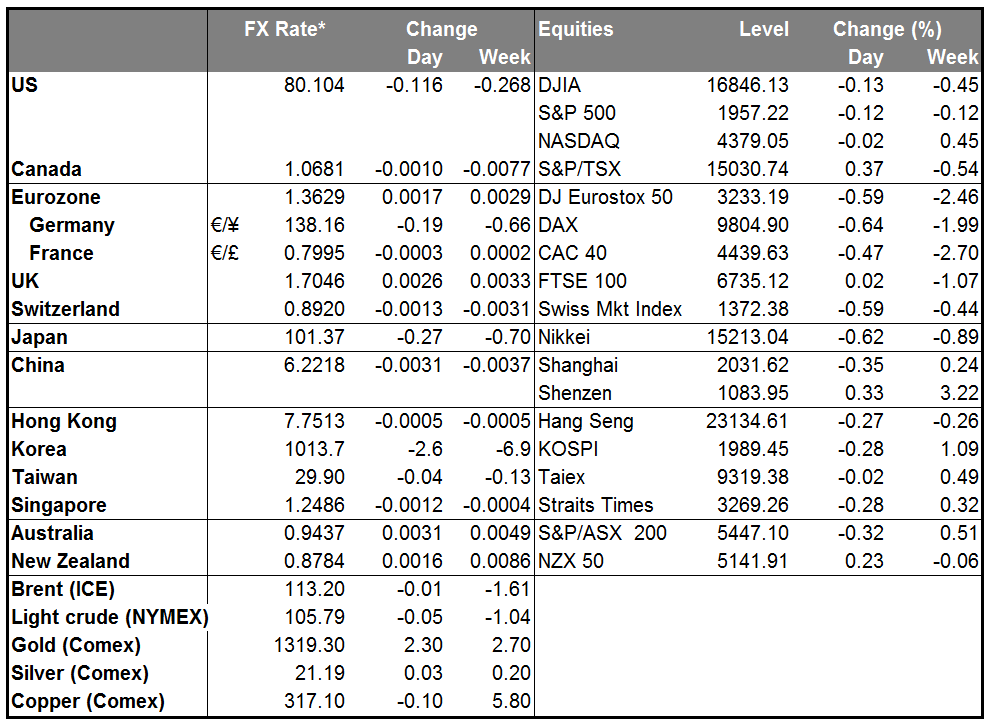
Inflation or no inflation? Yesterday’s US personal consumption expenditure (PCE) deflator came as expected at +1.8% yoy (previous: +1.6%). This indicator, the Fed’s favorite measure of inflation is getting close to the Fed’s target of 2%. Fed Chair Janet Yellen said after the last FOMC meeting that “recent readings on, for example, the CPI index have been a bit on the high side,” but the data are “noisy.” Was yesterday’s rise “noise” or “signal”? Richmond Fed President Lacker yesterday pushed back against Yellen’s comments, saying, “I don’t think the last few months are entirely noise” and that he has “been expecting inflation to firm this year.” St. Louis Fed President Bullard echoed that sentiment, saying that “inflation is picking up now” and adding, “I don’t think financial markets have internalized how close we are to our ultimate goals, and I don’t think the FOMC has internalized how close we are.” This is a big change for Bullard; a year ago he dissented at the FOMC meeting because he felt the Committee was not doing enough to prevent inflation from falling. That shows how much the picture has changed. Bullard also said he favors raising rates in early 2015.
Nonetheless the market ignored these statements and the Fed Funds futures cut another 5.5 bps from rate expectations for 2017 while bond yields declined 2-3 bps across the curve after consumer spending rose less than forecast. The dollar lost ground against most G10 currencies, while it was mixed vs EM.
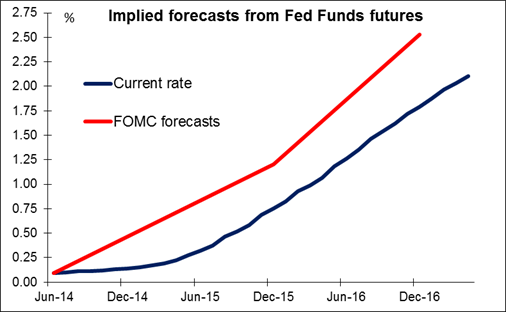
Personally, I agree with Bullard. “Investors should be listening to the committee,” he said. “They are not.” The market is currently forecasting that the Fed Funds rate will end 2015 around 0.68%, whereas the average forecast of the Committee is almost double that at 1.2%. For end-2016, the market is forecasting 1.69%, a 1 percentage-point increase over the year, while the FOMC is forecasting 2.53%, a 1.33 percentage-point increase. In other words, the FOMC is forecasting that hiking starts earlier and proceeds faster than the market currently assumes. It’s my expectation that the market will gradually start to discount at least the possibility of an earlier hike as inflation moves up and the unemployment rate falls. The question for the FX market though is whether that anticipation will be enough to counter the drop in real interest rates that’s likely to occur as inflation moves up faster than nominal rates.
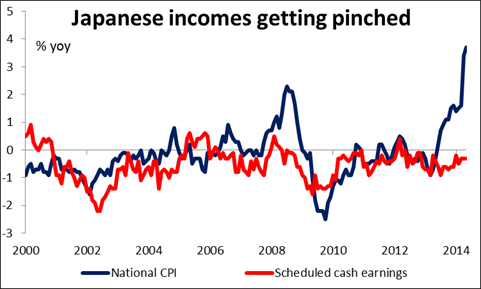
Japan’s usual end-of-month data dump produced a mixed picture for Japan. The inflation rate rose faster than expected as the effects of the hike in the consumption tax continue to work through to the retail level. On the other hand, household spending collapsed in May, falling even more than it did in April, which is saying a lot. And wages excluding overtime payments and bonuses fell for the 23rd consecutive month. That shows the fatal flaw at the heart of Abenomics: a rising CPI is not the same as inflation. Inflation is a rise in the general price level, including the price of labor. The idea behind getting inflation up in Japan is to try to stimulate economic activity, but if the net result is simply to diminish peoples’ purchasing power, it will never work. Unfortunately the hike in the consumption tax, which raised the CPI rate dramatically, has made further Bank of Japan loosening less likely in the near term. That could mean further strengthening of the yen. Indeed USD/JPY finally broke out of its recent channel overnight on the downside.
NZD rallied to nearly a record high after the country announced a higher-than-expected trade surplus for May, with both exports and imports exceeding expectations. I remain bullish on NZD. The other commodity currencies, AUD and CAD, also gained.
During the European day, the preliminary German CPI for June is expected to have risen 0.7% yoy, up slightly from 0.6% yoy in May. An acceleration in German inflation would further reduce the likelihood that the ECB will unveil any new measures at next week’s meeting and could therefore help shore up the euro. Eurozone’s final consumer confidence for June is also coming out, with no forecast being available. Sweden’s retail sales are forecast to have declined in May after rising in April, and Norway’s registered unemployment rate is expected to have risen to 2.8% in June from 2.7%. Final Q1 GDP estimates for the UK and France will be announced; the forecasts are the same as the previous estimate.
From the US, the only indicator we get is the final U of Michigan consumer confidence sentiment for June. The market forecasts it will be unchanged from the initial estimate.
We have only one speaker on Friday’s agenda. RBA assistant Governor Chris Kent addresses parliament committee on real estate.
The Market
EUR/USD sees as a hurdle the 200-period MA
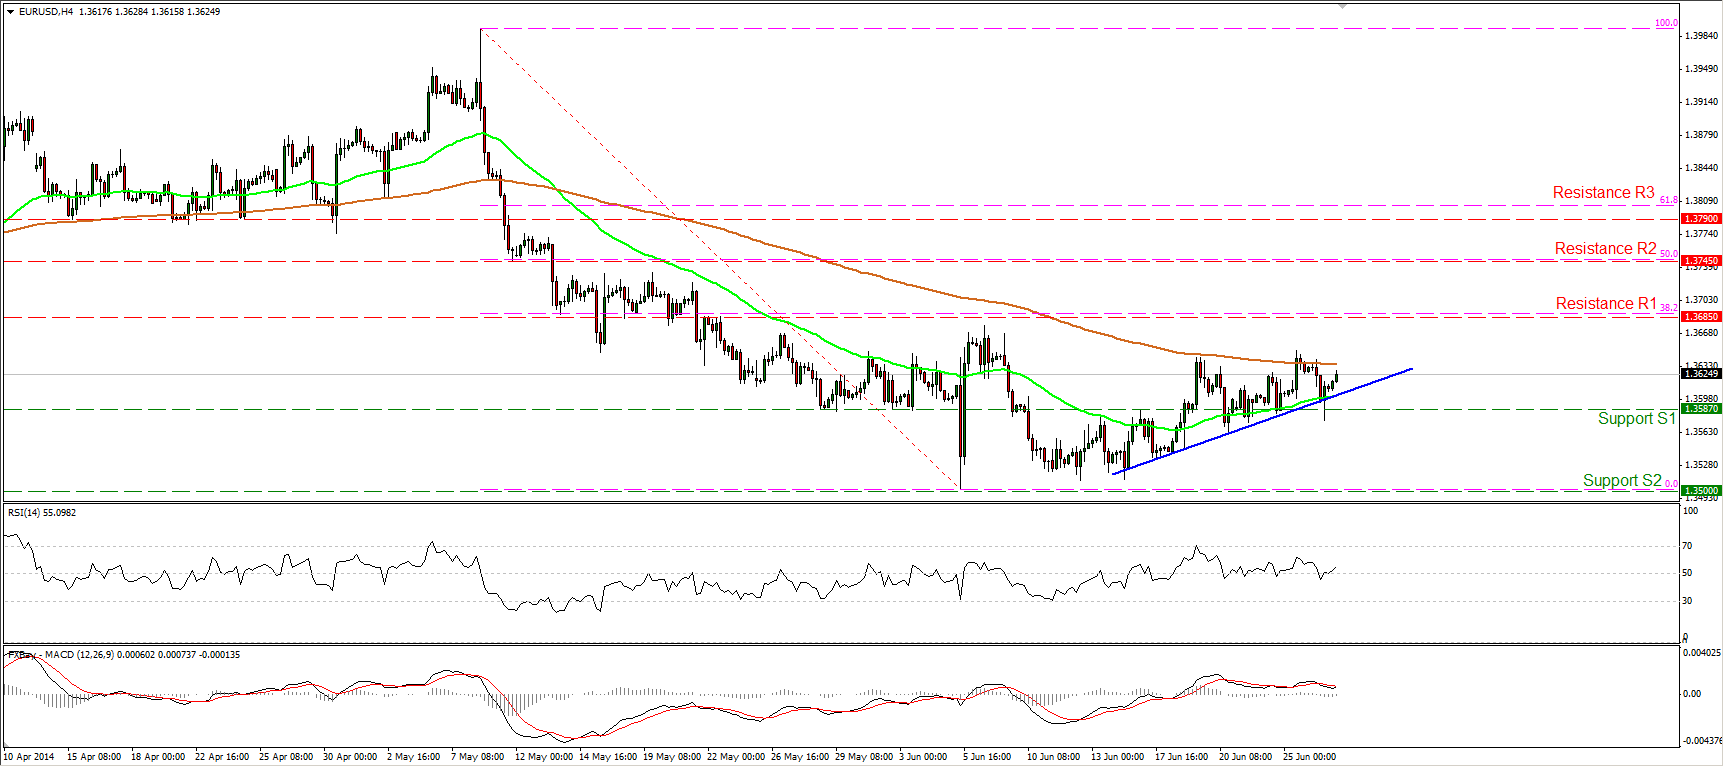
EUR/USD declined after finding resistance near the 200-period moving average, but then it rebounded from our support zone of 1.3587 (S1) and is currently ready for another test near the moving average. If the bulls are willing to drive the battle above the moving average this time, I would expect them to target the resistance of 1.3685 (R1), which coincides with the 38.2% retracement level of the 8th May- 5th June decline. The RSI started moving higher -crossing back above its 50 level and increasing the possibilities for more upside. However, it’s too early to argue for a trend reversal and as a result I would consider the recent advance as a correcting phase, at least for now.
• Support: 1.3587 (S1), 1.3500 (S2), 1.3475 (S3).
• Resistance: 1.3685 (R1), 1.3745 (R2), 1.3790 (R3).
EUR/JPY breaks below 138.25
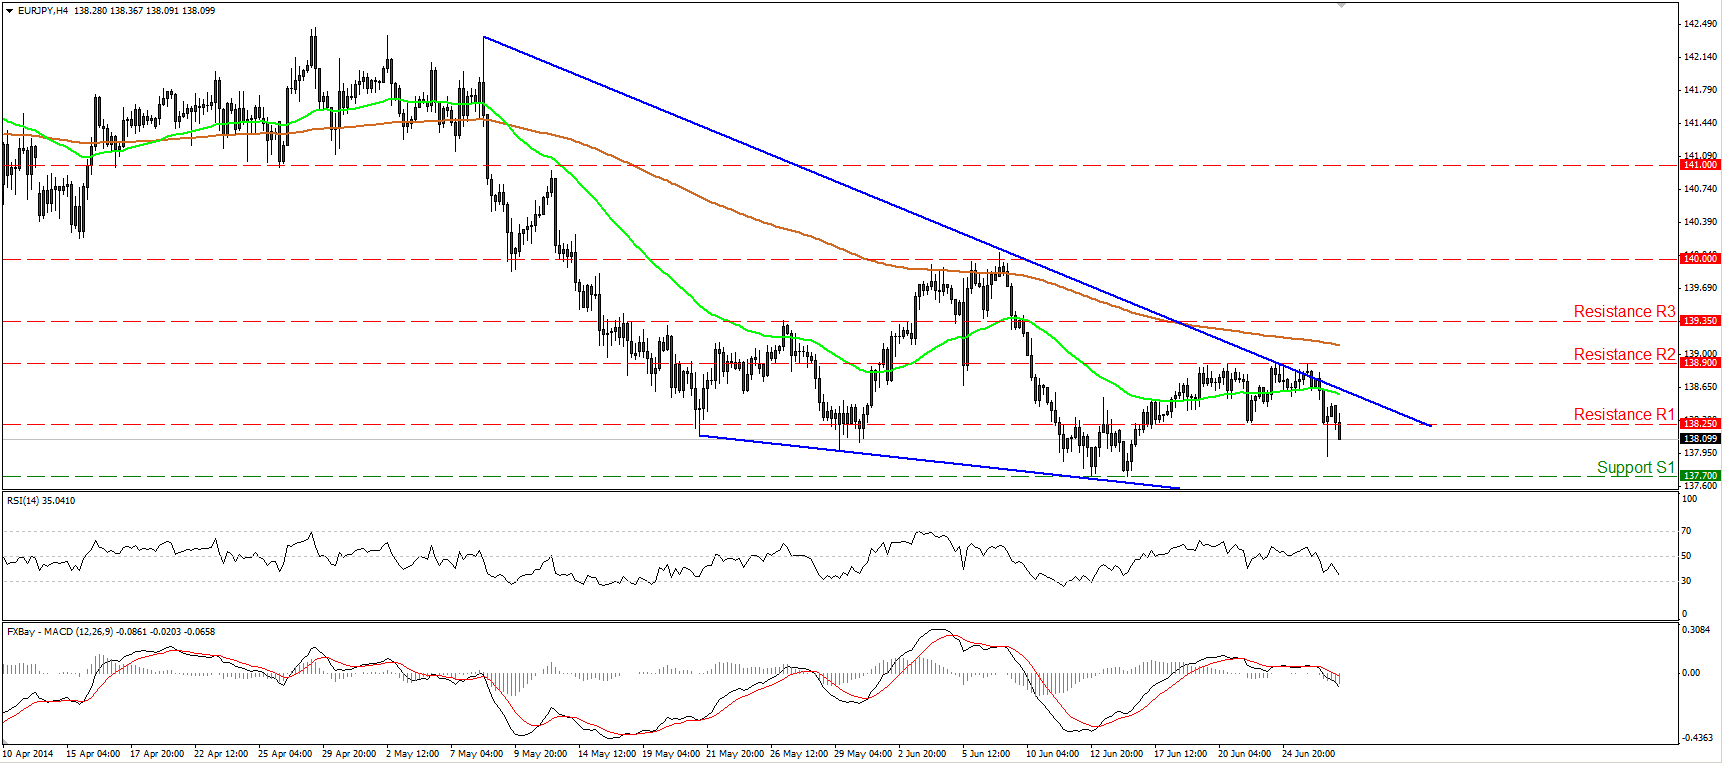
EUR/JPY tumbled after hitting the upper boundary of the of the falling wedge formation. The rate fell below the 138.25 hurdle and I would expect the bears to challenge the support of 137.70 (S1). Both our momentum studies moved lower, with the MACD falling below its signal and zero lines. This amplifies the case for the continuation of the decline. Nonetheless, as long as the rate is trading within the wedge, I would maintain my neutral stance as far as the overall picture is concerned. Only a decisive move out of the pattern could give clearer indications about the pair’s forthcoming trending direction.
• Support: 137.70 (S1), 136.75 (S2), 136.20 (S3).
• Resistance: 138.25 (R1), 138.90 (R2), 139.35 (R3).
Is GBP/USD ready for a higher high?
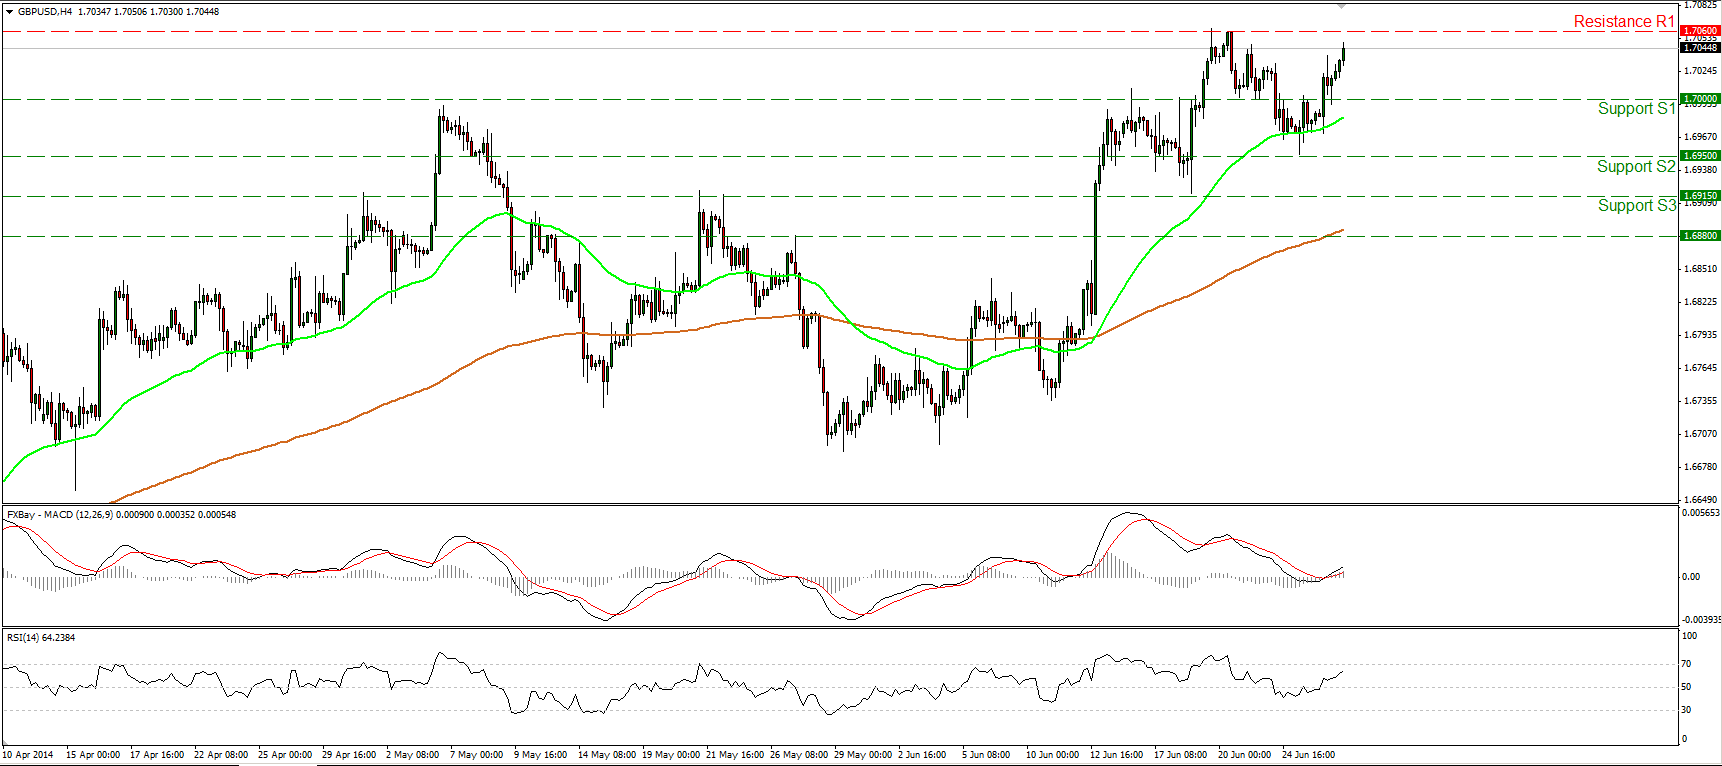
GBP/USD rebounded from 1.6950 (S2), forming a higher low, and emerged above 1.7000 again. At the time of writing, cable seems ready to challenge the highs of 1.7060 (R1). The next resistance lies at 1.7100 (R2) and if the bulls are strong enough to drive the battle above it, I would expect them to trigger extensions towards the 1.7200 (R3) area. The RSI is back above its 50 level, pointing up, while the MACD is back above its zero and signal lines, amplifying the case for further upside. In the bigger picture, the 80-day exponential moving average provides reliable support to the lows of the price action, keeping the long-term path to the upside.
• Support: 1.7000 (S1), 1.6950 (S2), 1.6915 (S3).
• Resistance: 1.7060 (R1), 1.7100 (R2), 1.7200 (R3).
Gold rebounds from the 1305 zone
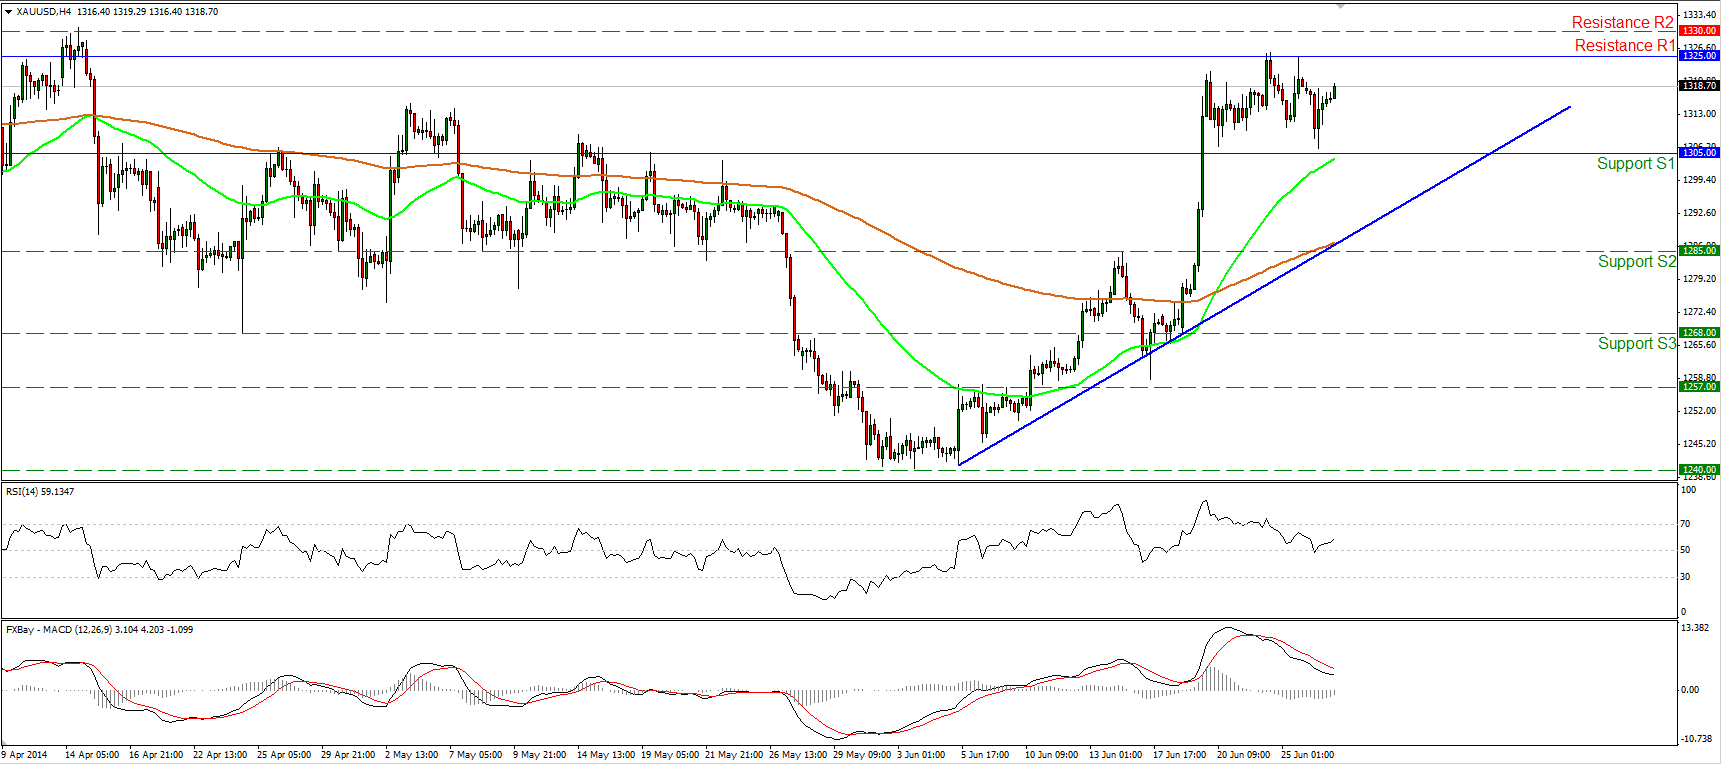
Gold moved lower on Thursday, and after finding support slightly above the 1305 (S1) barrier, it rebounded to trade virtually unchanged. Given that the yellow metal is trading between that support and the resistance of 1325 (R1) since the 19th of June, I consider the near-term path to be sideways. The RSI rebounded from its 50 barrier and moved higher, while the MACD moved lower remaining below its signal line. The mixed signals provided by our momentum studies corroborate my neutral view, for now. However, as long as the precious metal is trading above both the moving averages and above the blue uptrend line, the overall technical picture remains positive and a clear move above the highs of 1330 (R2) could reinforce the upside path.
• Support: 1305 (S1), 1285 (S2), 1268 (S3) .
• Resistance: 1325 (R1), 1330 (R2), 1342 (R3).
WTI still within a range
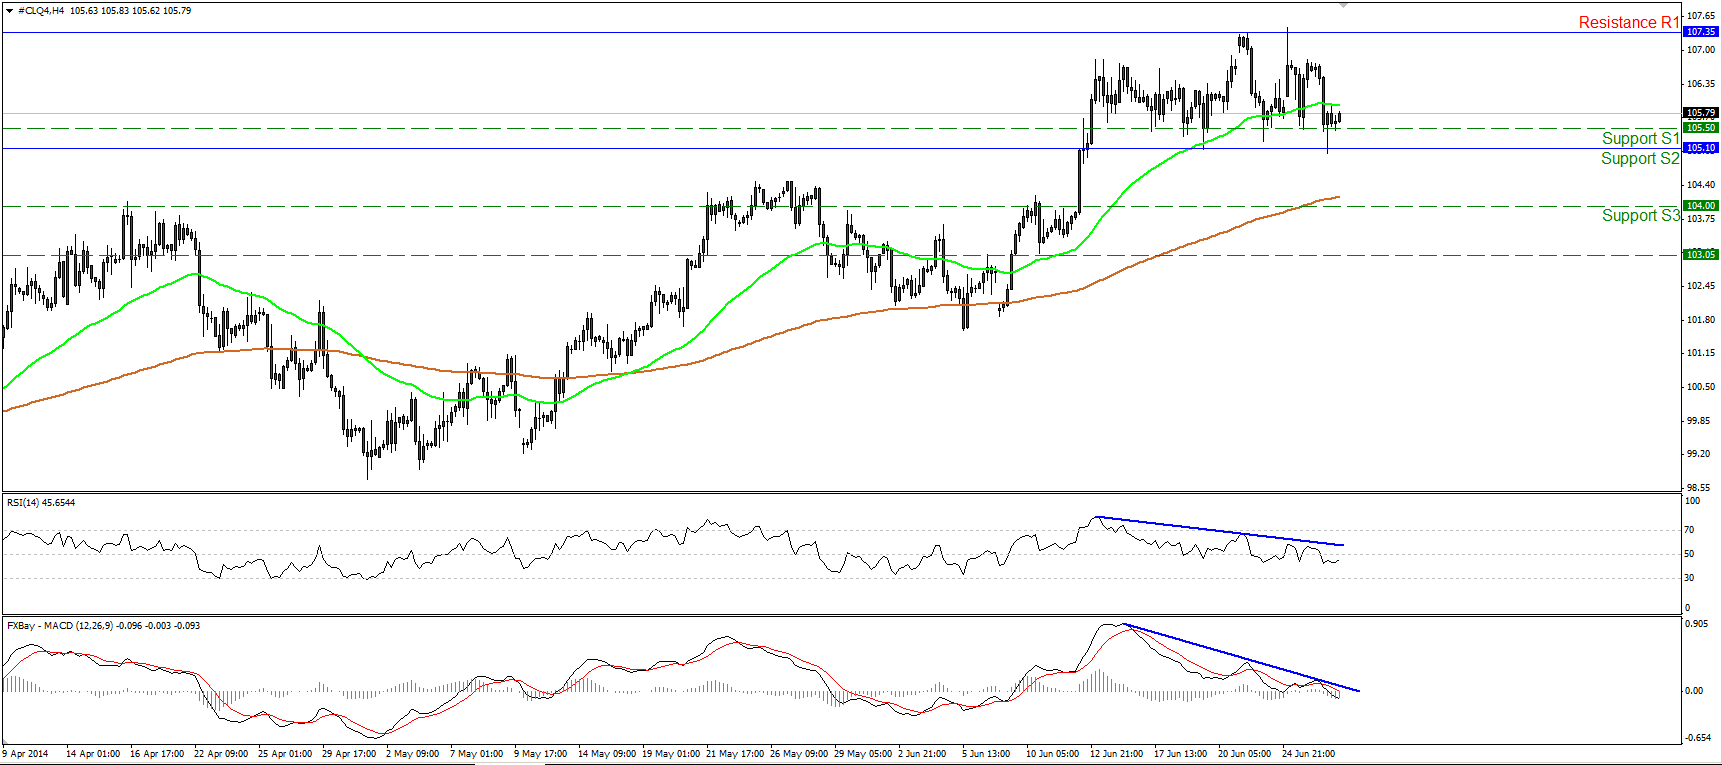
WTI declined yesterday to find support once again near the 105.10 (S2) area. Considering that WTI continues oscillating between that support and the resistance of 107.35 (R1), I still see a sideways path. Both our momentum studies continue moving below their downside resistance lines, while the MACD fell below both its trigger and zero lines. Only a decisive break out of the sideways range may provide more clues about the forthcoming directional movement of WTI.
• Support: 105.50 (S1), 105.10 (S2), 104.00 (S3).
• Resistance: 107.35 (R1), 108.00 (R2), 110.00 (R3).

