EUR/USD:
1.2711
Short-Term Trend: Sideways
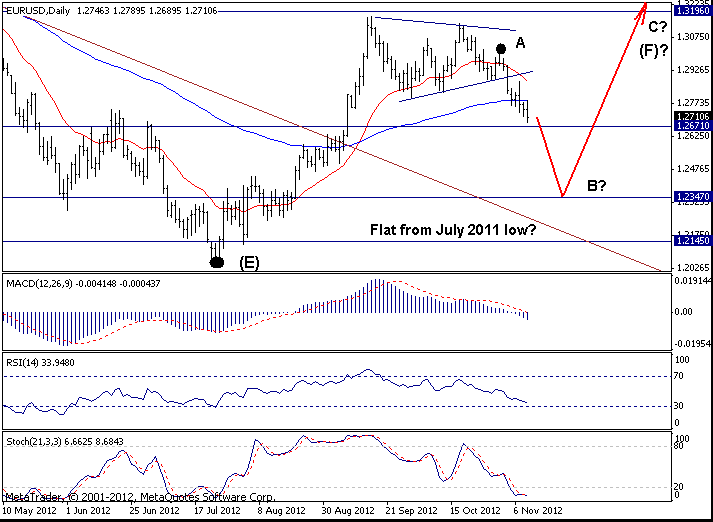
Outlook: As expected EUR broke lower last week and declined to as low as 1.2690. The daily trend is considered sideways, but the hourly trend is down and I expect to see further losses toward 1.2345 level eventually before another strong advance takes place.
A move above 1.2880 however, will indicate that the next leg up is likely under way already. In this case we can expect gains toward 1.3195 Fibonacci level.
Wavewise, I think that the current rise from the July 2012 low is wave (F) of a Diametric formation that started back at 2008 top.
Strategy: Stand aside.
GBP/USD
GBP/USD: 1.5894
Short-Term Trend: Sideways
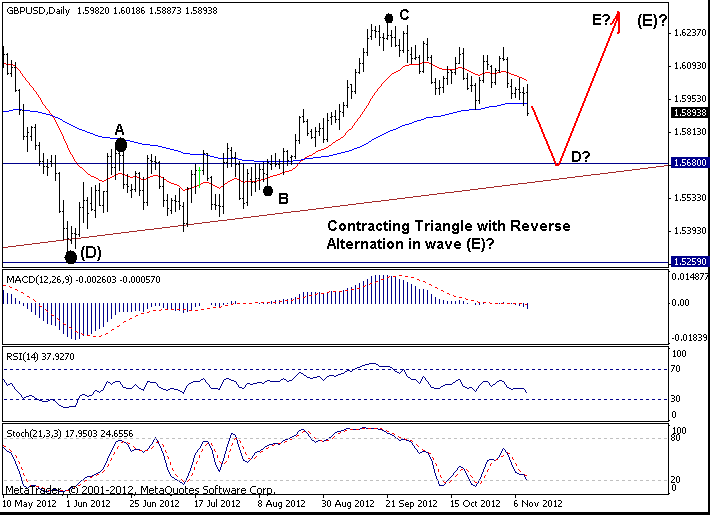
Outlook: GBP is under pressure but the decline from the September top is clearly corrective which means it is not likely that this decline is the beginning of a major move lower. Wavewise, I have moved the end of wave (D) (of the Contracting Triangle from the January 2009 low) from Jan 2012 low to May 2012 low. If correct, the current decline will find support above the 1.5680 level and another rally toward 1.63 will be seen later this year or early next year.
Strategy: Stand aside.
USD/JPY
USD/JPY: 79.47
Short-Term Trend: Sideways
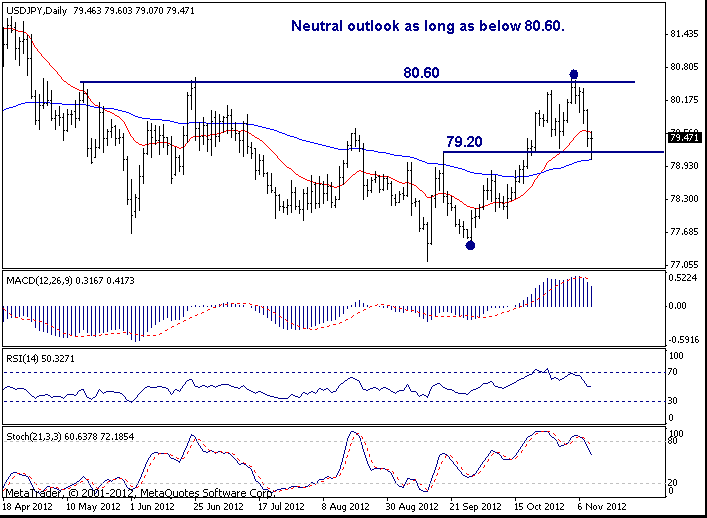
Outlook: Contrary to my expectations USD declined last week and move below 79.25 level on Friday. With that move down, the previous uptrend has been negated. Well, the prices are sill above the 100-day moving average, so a bullish case can still be made here, but with the failure at the 80.60 key resistance level, I think that the outlook on the daily chart is more neutral now than bullish. That means, we can see choppy trading between 77.00 and 80.00 in the next few weeks. Only a move above 80.60 will change the picture on the daily chart to bullish.
Strategy: The hypothetical long from 79.25 was stopped out at breakeven last week.
