 EUR/USD M5" title="EUR/USD M5" width="800" height="670" />
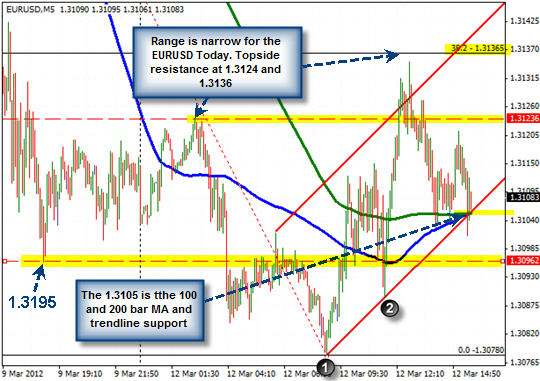
The EURUSD has fallen below trendline and the 100 and 200 bar MA on the 5 minute intraday chart at 1.3105 currently, but action remains choppy in early NY trade. The range today is a narrow 57 pips today for the pair after the trend move down after the better than expected NFP report on Friday. The range has the possibility of being extended (the narrowest range for 2012 so far has been 57 pips). The 20 day average range for the pair is 120 pips.
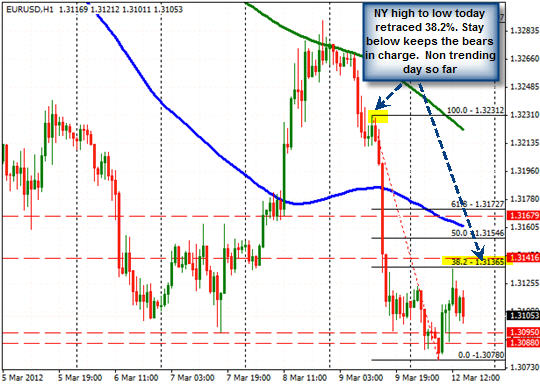
The Asian high came in at 1.3123 level and will be a level to watch on the topside for upside clues. The 1.3136 level is the 38.2% of the move down from the NY high on Friday. On the downside, the 1.3095 low from Friday (and also Wednesday’s low) will be needed to be breached to keep the pressure on for the pair.
 EUR/USD H1" title="EUR/USD H1" width="800" height="670" />
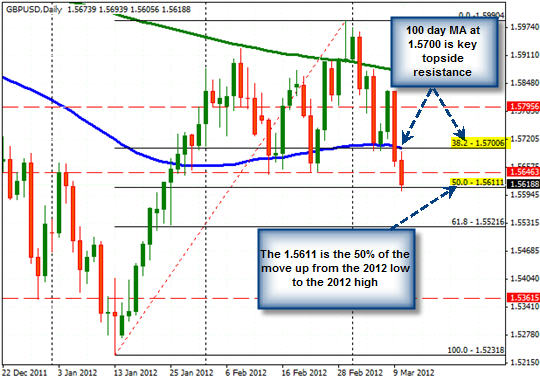
GBPUSD tests 50% of 2012 range and fails
 GBP/USD" title="GBP/USD" width="800" height="670" />
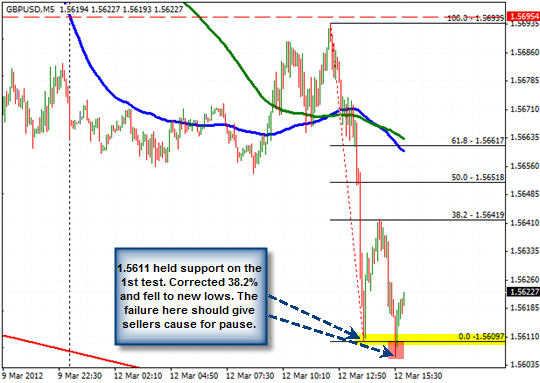
The GBPUSD tested the 50% of the move up from the 2012 low and failed on a break at the 1.5611. The failure may give the profit taking buyers more confidence in buying a dip as risk is limited. The key topside resistance comes in at the 1.5695/1.5700 level. This is where the 100 day MA and where the 38.2% of the 2012 range was broken. Before that level, a move above the 1.5642 corrective high off the inital low today, will be needed to be broken to give the bulls/profit takers, some added buying incentive.
 GBP/USD M5" title="GBP/USD M5" width="800" height="670" />
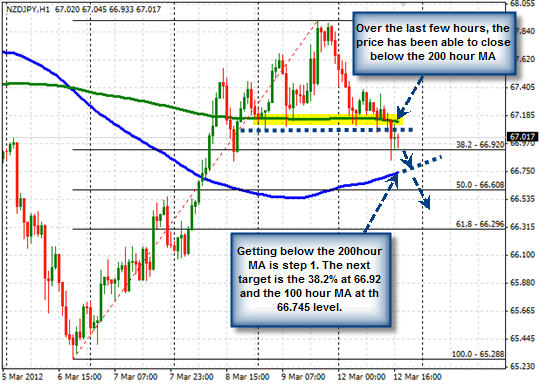
NZDJPY falls below 200 hour MA
 NZD/JPY H1" title="NZD/JPY H1" width="800" height="670" />
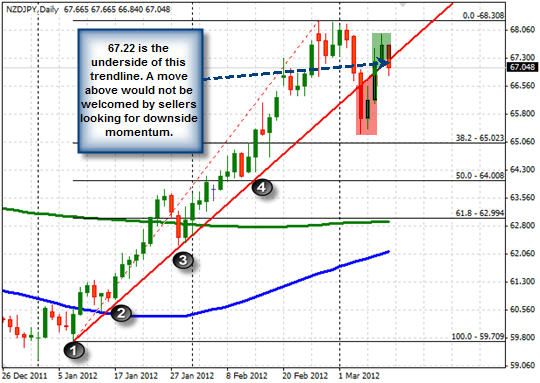
The NZDJPY has fallen below the 200 hour MA after spending most of the last few days above the flattening moving average. The move above the 200 hour MA (at 67.14) on Thursday should have led to further upside momentum – and it did – but that momentum could not be sustained and the move below the level has taken some of the bullishness away from the bulls. Traders will be watching the 200 hour MA today to see if the sellers have the strength to stay in charge. That strength will be reflected in a subsequent move below the 38.2% of the move up from last week (at 66.92) and then the 100 hour MA at the 66.745 level currently.
 NZD/JPY" title="NZD/JPY" width="800" height="670" />
Bobbys Corner-Open Market-March.12.2012
Good Morning:
Looks like a quiet start to the week-with the US economic calender bare for today.
Last week brought us the news that Greece will get the needed funds to stave off a default on March 20. So for the time being the risk of default is off the table. Greece has a bond payment of 14.5 billion euros due next week.
10 year borrowing costs have fallen under 5% for both Italy and Spain, but Portugal is paying more than 13% for the same maturities.
On Tuesday, the Republican Presidential primary season keeps going-with the candidates heading down South.
Commodity markets are lower-with gold, silver and oil leading the way.
Asian equity markets were mixed-while Europe is lower-as are US Futures.
