
EUR/USD doing quite a dance around the 1.3000 as we head into a triple witching session in the US. Market close today likely to set direction for much of next week.
EUR/USD has given day traders whiplash today with three sharp traverses of the key psychological pivot area at 1.30 ahead of a key US session that sees the expiry of stock options, key financial futures and options on those futures, the so-called “triple witching” that takes place every three months.
The day was extremely light on developments and extremely heavy on choppy back and forth trading as EUR/USD zoomed back and forth around 1.30, GBP/USD made a 12-month high – and then reversed back lower before reversing back higher before…one quickly gets the idea. Friday is what the mentor of one of my mentor called “amateur day” and a day like today shows why.
I can’t come up with anything new to say for today: short term, we’re working through the sugar high of QE3 and then the BoJ (the latter of which actually triggered profit taking rather than a further new sugar high). Today we’re seeing attempts at extending a small comeback surge in the risk-on/sugar-high trade, and the end of today will probably tell us whether that surge will fail or extend well into next week, depending on the strength of the close. See the EUR/USD chart below, for example.
Chart: EUR/USD
EUR/USD is battling for the 1.3000 level today, a strong or weak close today could set up the direction for the first half or more of next week, while if we settle where we are trading now (right on the 1.30 area in EUR/USD), the uncertainty extends.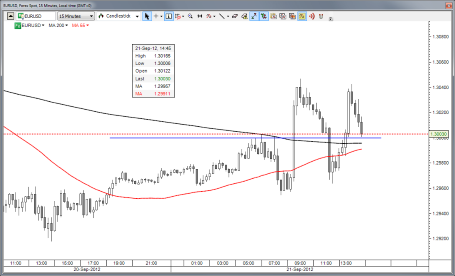 EUR/USD" title="EUR/USD" width="455" height="276">
Looking ahead
Let’s see where we close the week vis-à-vis the 1.30 level in EUR/USD, the attempt at the new high in GBP/USD, etc.. as we are in a bit of pivot zone here for the short-term. AUD/USD is another example of this: 1.0500/25 is an important retracement zone ahead of the most important resistance up toward 1.0600/50 and the downside view is not more firmly compelling or confirmed until we get back below 1.0365/35 and even lower.
At the beginning of this week, Hussman funds’ weekly commentary indicated that their metrics showed the “single lowest point” for prospective return versus risk in a century of data. He has been suggesting that long-term prospective returns have been poor for quite some time, far longer than this market has rallied in recent months. I don’t bring that up to make fun of Mr. Hussman, who has a great long-term track record and has a great command of the big themes in the economy.
I think his metrics are solid and just go to show how warped this market has become by the liquidity blitz from the worlds’ central banks. Risk appetite is like a foie gras duck, having a liquidity tube jammed down its throat repeatedly to force the markets higher. I don’t like taking a metaphor too far, but eventually all of this force feeding is going to cause debilitating illness in the economy and has already perturbed markets for far too long.
Economic Data Highlights
- UK August Public Sector Net Borrowing out at 12.4B vs. +13.2B expected and -1.9B in July
- Canada August CPI out at +0.2% MoM and +1.2% YoY vs. +0.3%/+1.3% expected, respectively and vs. +1.3% YoY in July
- Canada August Core CPI out at +0.3% MoM and +1.6% YoY vs. +0.3%/+1.5% expected, respectively and vs. +1.7% YoY in July
- US Fed’s Lockhart to Speak (1640)
- Japan BoJ Minutes of Aug meeting (Sun 2350)
Which stock should you buy in your very next trade?
With valuations skyrocketing in 2024, many investors are uneasy putting more money into stocks. Unsure where to invest next? Get access to our proven portfolios and discover high-potential opportunities.
In 2024 alone, ProPicks AI identified 2 stocks that surged over 150%, 4 additional stocks that leaped over 30%, and 3 more that climbed over 25%. That's an impressive track record.
With portfolios tailored for Dow stocks, S&P stocks, Tech stocks, and Mid Cap stocks, you can explore various wealth-building strategies.