Forex News and Events:
The risk sentiment remains limited in the FX markets. The EUR-complex trade in tight ranges, while the Scottish referendum vote is still in traders’ focus. According to the latest YouGov poll, the “yes” vote has retreated from 51% to 48%. The referendum in Scotland pushes Catalans toward Madrid. It is their turn to ask for independence. In Canada, the weak oil prices weigh on the Loonie, large USD/CAD option bids at 1.1000/35/50 will likely keep the downside limited before the weekly closing bell.
EUR traders chase top selling opportunities
The EUR-complex remains in standby in the absence of fresh news/events. Given the oversold conditions, the short-coverings and tactical EUR long trades shaped the EUR levels this week. However, the upside attempts remain capped as there is more incentive to play on the sell side, than on the long side of the game. Traders chase good top-selling opportunities, as a clear majority refrain from taking the EUR-long risk too long given the Ukraine/Russia tensions and the contagion fears of the Scottish independence vote (September 18th). As to confirm worries, Catalans walked once again to Madrid yesterday, to ask for an independence referendum at their turn. On the other hand, additional EU sanctions against Russia will take effect today.
Data-wise, the Spanish and Italian inflation figures remained soft as widely expected. The Euro-zone August CPI will be released on September 17th; traders bet for slightly better CPI on month (0.1% m/m vs. -0.7% printed last); the CPI core estimate will perhaps remain steady at 0.9% y/y. The ECB President Draghi said he would take additional action to meet the ECB’s price stability mandate, while VP Constancio said that the QE cannot be excluded. The EUR bias remains comfortably negative.
This said, the short-term direction needs to be redefined with respect to Fed policy outlook. The Fed will gather on September 16-17th and is expected to reduce the pace of its monthly asset purchases down to 15bn dollars. Despite the SF Fed paper published this week, (suggesting that investors bet for longer period of lower interest rates than the Fed itself), the Fed Chair Yellen will likely keep a balanced tone thus traders should stand ready for short-term reversals in capital flows.
Loonie hit by low oil prices
The Loonie is subject to strong selling pressures as the Crude Oil prices hit the lowest levels since January 2014. The front end of the futures curve declined faster over the past week, the contracts with 2017+ maturity recovered, confirming the short-run concerns on oil demand. Weak economic recovery from Europe and China keep the downside pressures high in energy prices. According to International Energy Agency’s report, “Oil prices fell sharply in August, weighed down by abundant supplies and further indications of slow global economic and oil-demand growth”. Saudi Arabia’s exports fell to lowest in almost three years and the global oil demand will grow by 1.2 million barrels per day in 2015; this is 165’000 barrels less per day than forecasts released a month ago.
The generic crude oil futures traded down to an intraday low of $90.43 yesterday, pushing USD/CAD back above 1.1000. Trend and momentum indicators turned positive, the pair stabilized above 1.1028 (Fib 38.2% from March-July drop). We see support building above 1.1000/28. Large option bids are placed at 1.1000/35/50 before the weekly closing bell.

Today's Key Issues (time in GMT):
2014-09-12T12:30:00 USD Aug Retail Sales Advance MoM, exp 0.60%, last 0.00%2014-09-12T12:30:00 USD Aug Retail Sales Ex Auto MoM, exp 0.30%, last 0.10%
2014-09-12T12:30:00 USD Aug Retail Sales Ex Auto and Gas, exp 0.50%, last 0.10%
2014-09-12T12:30:00 USD Aug Retail Sales Control Group, exp 0.50%, last 0.10%
2014-09-12T12:30:00 USD Aug Import Price Index MoM, exp -1.00%, last -0.20%
2014-09-12T12:30:00 USD Aug Import Price Index YoY, exp -0.40%, last 0.80%
2014-09-12T13:00:00 CAD Aug Teranet/National Bank HPI MoM, last 1.10%
2014-09-12T13:00:00 CAD Aug Teranet/National Bank HPI YoY, last 4.90%
2014-09-12T13:00:00 CAD Aug Teranet/National Bank HP Index, last 165.84
2014-09-12T13:55:00 USD Sep P Univ. of Michigan Confidence, exp 83.3, last 82.5
2014-09-12T14:00:00 USD Jul Business Inventories, exp 0.40%, last 0.40%
The Risk Today:
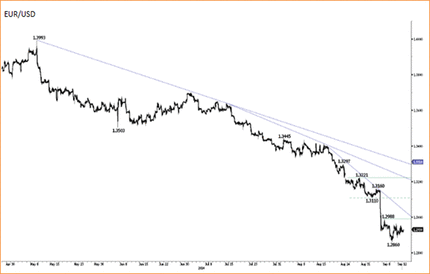
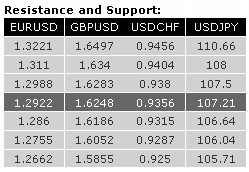
EUR/USD is trying to bounce from its oversold decline. However, the hourly resistance at 1.2988 (05/09/2014 high) has held thus far. Another hourly resistance can be found at 1.3110 (02/09/2014 low). A break of the hourly support at 1.2860 would signal the resumption of the underlying downtrend. In the longer term, EUR/USD is in a succession of lower highs and lower lows since May 2014. The break of the key support at 1.3105 (06/09/2013 low) opens the way for a decline towards the strong support area between 1.2755 (09/07/2013 low) and 1.2662 (13/11/2012 low). A key resistance lies at 1.3221 (28/08/2014 high).
GBP/USD has improved as can be seen by the break of the hourly resistance at 1.6233 (08/09/2014 high). Another hourly resistance can be found at 1.6340 (05/09/2014 high), while a key resistance stands at 1.6497 (03/09/2014 high). Hourly supports lie at 1.6186 (11/09/2014 low) and 1.6052. In the longer term, prices have collapsed after having reached 4-year highs. The breach of the key support at 1.6220 confirms persistent selling pressures and opens the way for further decline towards the strong support at 1.5855 (12/11/2013 low). A key resistance now stands at 1.6644.
USD/JPY continues its steep rise despite deep short-term overbought conditions. The technical structure remains positive as long as the support at 106.04 holds. An hourly support can be found at 106.64. A long-term bullish bias is favoured as long as the key support 100.76 (04/02/2014 low) holds. The break to the upside out of the consolidation phase between 100.76 (04/02/2014 low) and 103.02 favours a resumption of the underlying bullish trend. A test of the major resistance at 110.66 (15/08/2008 high) is expected.
USD/CHF is challenging the resistance at 0.9404 (61.8% retracement). Hourly supports can now be found at 0.9315 (09/09/2014 low) and 0.9287 (05/09/2014 low). A key resistance stands at 0.9456. From a longer term perspective, the technical structure calls for the end of the large corrective phase that started in July 2012. The break of the strong resistance at 0.9250 (07/11/2013 high) opens the way for a move towards the next strong resistance at 0.9456 (06/09/2013 high). A key support now lies at 0.9104 (22/08/2014 low).

