Forex News and Events
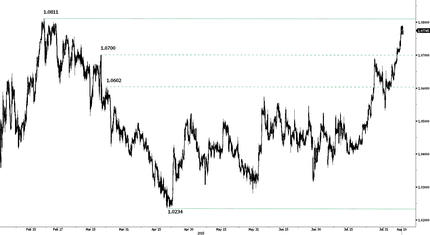
EUR/CHF hits fresh highs
EUR/CHF has risen more than 2.20% over the last two weeks and is back above the 1.08 threshold for the first time since January 15, printing fresh highs at 1.0845 this morning. The euro is set to challenge the next key resistance standing around 1.0870 (200-day moving average), as economic conditions in the euro-area have begun to show signs of improvement. However, one can wonder whether the Swiss National Bank is behind the recent Swissie devaluation. According to recent data, we believe that the odds of a SNB intervention in the FX market are very narrow given the stable level of sight deposits within the central bank. Total sight deposits remained roughly stable during the week ending August 7 at CHF462.32bn versus CHF462.05bn a week earlier. The rise in EUR/CHF is mostly due to a stronger EUR - over the last 5 days, the EUR appreciates 2% against the AUD, 1.84% against the CHF, 1.67% against the JPY, 1.32% against the USD and 1.20% against the GBP - that has found support from a picking up in growth and improving inflation levels, together with a broad based optimism regarding the Greek bailout negotiations. We do not rule out further SNB intervention but we believe M. Jordan will rather watch and enjoy the ride.
PBoC cut the yuan daily fixing
In a bombshell move, PBoC devalued the yuan daily reference rate, by 1.86% to 6.2298. As a consequence, CNY spot weakened 2.0% to 6.32, and CNH weakened 2.1% to 6.35. In the accompanying statement, the PBoC noted that the adjustment was a one-off and was justified by the fact that yuan's effective rate was stronger than other currencies. Moving forward, the PBoC stated fixing will be based on market maker’s quotes combined with closing prices and should help converge on-shore and off-shore markets. The debate is now raging on why the PBoC made this move. On the surface, the move increased flexibility, which suggests a play towards, including in the IMF's SDR. However, there needs to be some consideration that today's adjustment is geared towards a competitive devaluation as a part of the regional stealth “currency wars” that have been waging for years now. This line of thinking indicates that the war has taken a serious turn. A deviation from utilization of monetary policy easing (which has become an accepted practice) into direct currency manipulation. Pundits suggest that China has plenty of firepower to ease conditions without directly acting on competitive devaluation, yet this is a strategy China understands well. On Saturday, July trade data released showed that China’s exports dropped 8.3% y/y. Combined with the generally unexpectedly soft economic data, China's policy makers are required to act decisively. We would watch MYR, THB, KRW and IDR for a quick reaction, since they have lost substantial competitive positions against China in recent months.
EUR/CHF - Pushing higher


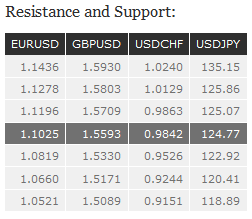
EUR/USD EUR/USD has thus failed to challenge resistance at 1.1045 (declining channel). Over the last month, the pair is setting lower highs, and therefore, we remain bearish over the medium-term. Hourly resistance lies at 1.1278 (29/06/2015 high). Stronger resistance lies at 1.1436 (18/06/2015 high). Support can be found at 1.0660 (21/04/2015 low). In the longer term, the symmetrical triangle from 2010-2014 favors further weakness towards parity. As a result, we view the recent sideways moves as a pause in an underlying declining trend. Key supports can be found at 1.0504 (21/03/2003 low) and 1.0000 (psychological support). Break to the upside would suggest a test of resistance at 1.1534 (03/02/2015 reaction high).
GBP/USD GBP/USD has shifted into a consolidation pattern after slight bullish recovery. However, the drift lower indicates persistent selling pressure. Stronger support is given at the 38.2% Fibonacci retracement at 1.5409. Hourly resistance is given at 1.5733 (01/07/2015 high). We remain bearish on the pair. In the longer term, the technical structure looks like a recovery bottom whose maximum upside potential is given by the strong resistance at 1.6189 (Fibo 61% entrancement).
USD/JPY USD/JPY continues to recover after its recent sell-off, after breaking hourly resistance at 124.62 (10/06/2015 high). However, the road is now wide open towards the stronger resistance at 125.86 (05/06/2015 high). Hourly support is given by the 38.2% Fibonacci retracement at 122.04. A long-term bullish bias is favored, as long as the strong support at 115.57 (16/12/2014 low) holds. A gradual rise towards the major resistance at 135.15 (01/02/2002 high) is favored. A key support can be found at 118.18 (16/02/2015 low).
USD/CHF USD/CHF has thus far failed to hold above 0.9863, suggesting persistent selling pressures. (13/04/2015 high). The pair still remains in a short-term upside momentum. Hourly support can be found at 0.9151 (18/06/2015 low). In the long-term, there is no sign to suggest the end of the current downtrend after failure to break above 0.9448 and reinstate bullish trend. As a result, the current weakness is seen as a counter-trend move. Key support can be found at 0.8986 (30/01/2015 low).

