EUR/CAD
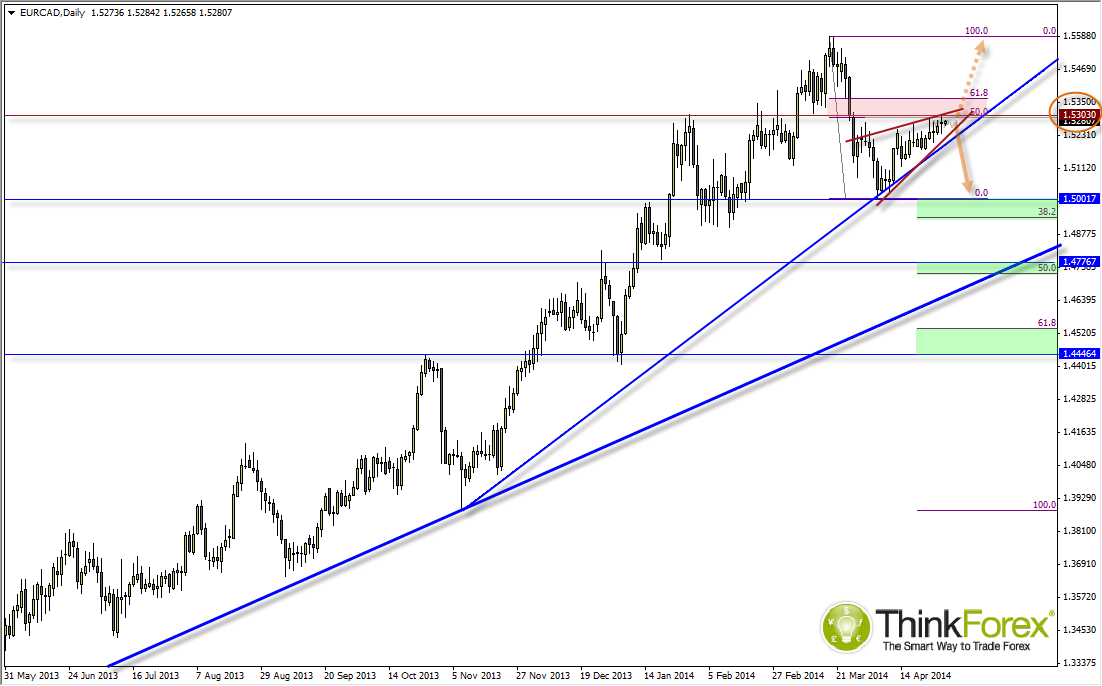
Bullish momentum since the 1.50 swing low has not been exactly convincing of a bullish move, and a sit below resistance we could be lining up for a bearish break.
What first caught my eye about this chart was the trajectory (or lack of) the recent gains in comparison to the bearish decline from 1.55 highs. Yesterday's high tested the 50% retracement level (also the monthly pivot for the next 2 days), and closed the day with a Rikshaw Man Doji to warn of pending weakness.
I would like to add that at this stage I am not ruling out the possibility of another high, but if we do remain below the 50% retracement then it increases the odds of an acceleration of a bearish move.
I have highlighted the potential bearish wedge in red, however be warned that any breakout to the downside would soon meet an ascending trendline Nov '13, which if tested and held as support would then confirm it as a trendline using the 3-touch method. Any break below the 2nd trendline would put us back into the bearish move and for price to target 1.50.
Until then, as long as price remains above the suspected bullish trendline we remain technically bullish. A break above 61.8% targets 1.56 highs.

