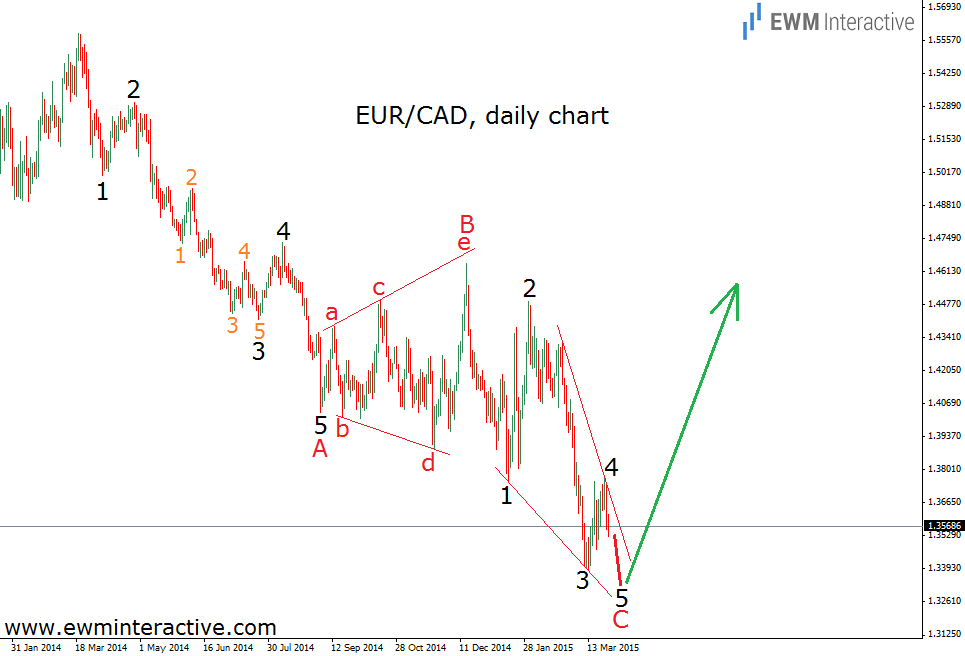
It’s been more than four months since we published 'EUR/CAD, Are The Bears Getting Tired?'. On March 27th, while EUR/CAD was trading near 1.3570, we suggested that “wave 5 of C should make one last bottom before the bears run out of power. After that, EUR/CAD should be looked at from the bullish side”.
Here is what the daily chart of the pair was showing from the perspective of the Elliott Wave Principle. It explains why we were expecting a major bullish reversal.
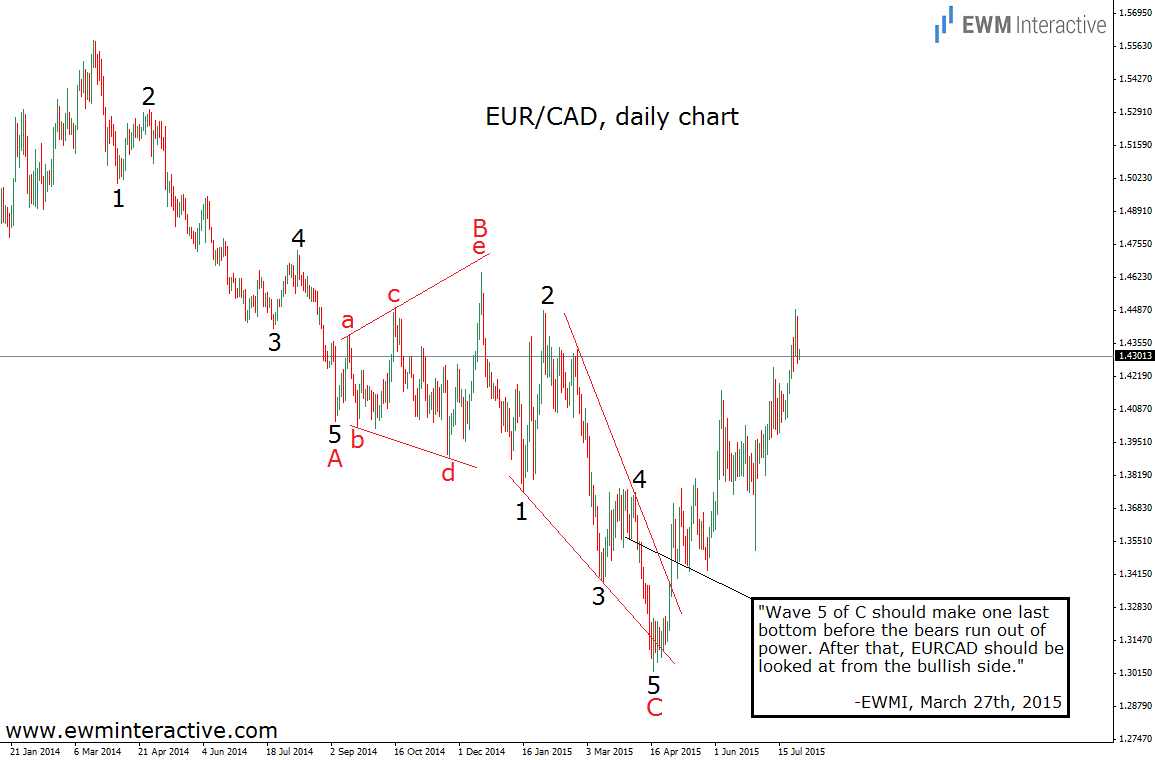
As visible, we assumed EUR/CAD is in the final stages of a zigzag A-B-C pull-back. A textbook five-wave impulse in wave A and an expanding triangle in wave B. We thought wave C is going to be an ending diagonal. That why we were waiting for its fifth wave down, before the bulls could return. The chart below shows how EUR/CAD has been developing since that forecast.
As you can see, wave 5 of C ended at 1.3022. After that, the bulls took the wheel. EUR/CAD reached as high as 1.4493 on Monday, July 27th. A recovery of nearly 1500 pips so far. This situation provided an excellent example of the wave principle’s ability to help you predict major reversals by using nothing else, but a chart.
From now on, the exchange rate should be expected to continue higher in the long term, since the whole decline from 1.5586 is a correction. And when the larger trend resumes, corrections should be fully retraced. The big picture target of 1.56 is still on the table.
