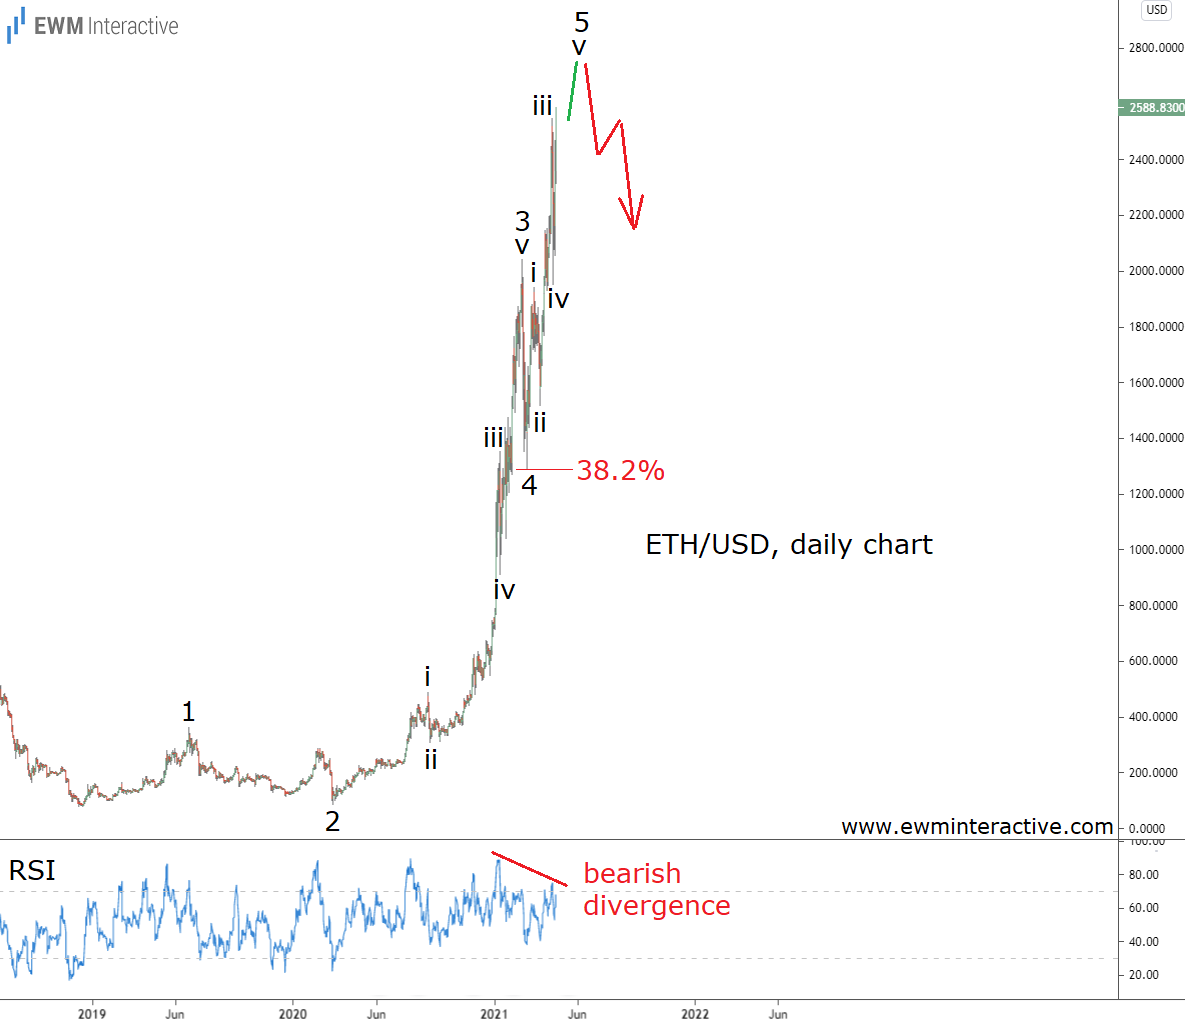
For the crypto space, it is 2017 all over again, except bigger. The two biggest cryptocurrencies – Bitcoin and Ethereum – exceeded their previous records and then some. ETH/USD, in particular, is now approaching $2600 and is not very far from doubling its January 2018 peak level.
Furthermore, ETH/USD is up 32-fold from its December 2018 low. As the price keeps going higher, it is getting increasingly difficult for people to resist the fear of missing out. In our opinion, however, that is exactly what we all need to do. To quote Warren Buffett, “a bull market is like sex – it feels best just before it ends“. Besides, the daily chart of ETH/USD below reveals a pattern the bulls should worry about.

The chart puts Ethereum‘s surge from $80.90 into Elliott Wave context. The structure of this phenomenal rally can be labeled 1-2-3-4-5, where the five sub-waves of 3 and 5 are also visible. Wave 2, albeit deep, didn’t fall below the starting point of wave 1. Wave 3 is extended and wave 4 ended shortly after touching the 38.2% Fibonacci level.
This means the current surge to nearly $2600 must be the fifth wave final wave of the impulse pattern. Unfortunately for the bulls, the theory states that a correction follows every impulse. The bearish RSI divergence between waves 3 and 5 is another reason not to trust the bulls too much right now. Once wave 5 finds its ceiling, a notable reversal should occur in ETH/USD.
