ETH/USD analytics and the updated Ethereum forecast.
Is ETH worth buying? Where will the price for the most popular altcoin will go?In this post I applied the following tools: fundamental analysis, all-round market view, market balance level, volume profile, graphic analysis, trendline analysis, Range bars, Tic-Tac-Toe chart.
As usual, the second crypto analysis in the week is ETH/USD analysis. Ethereum is actively striving for the status of the second largest cryptocurrency by market cap, and no other coin has shifted ETH from its top position for a long term.
To revise my trading forecast for Ethereum, I’ll start with analyzing its trend and ETH/USD.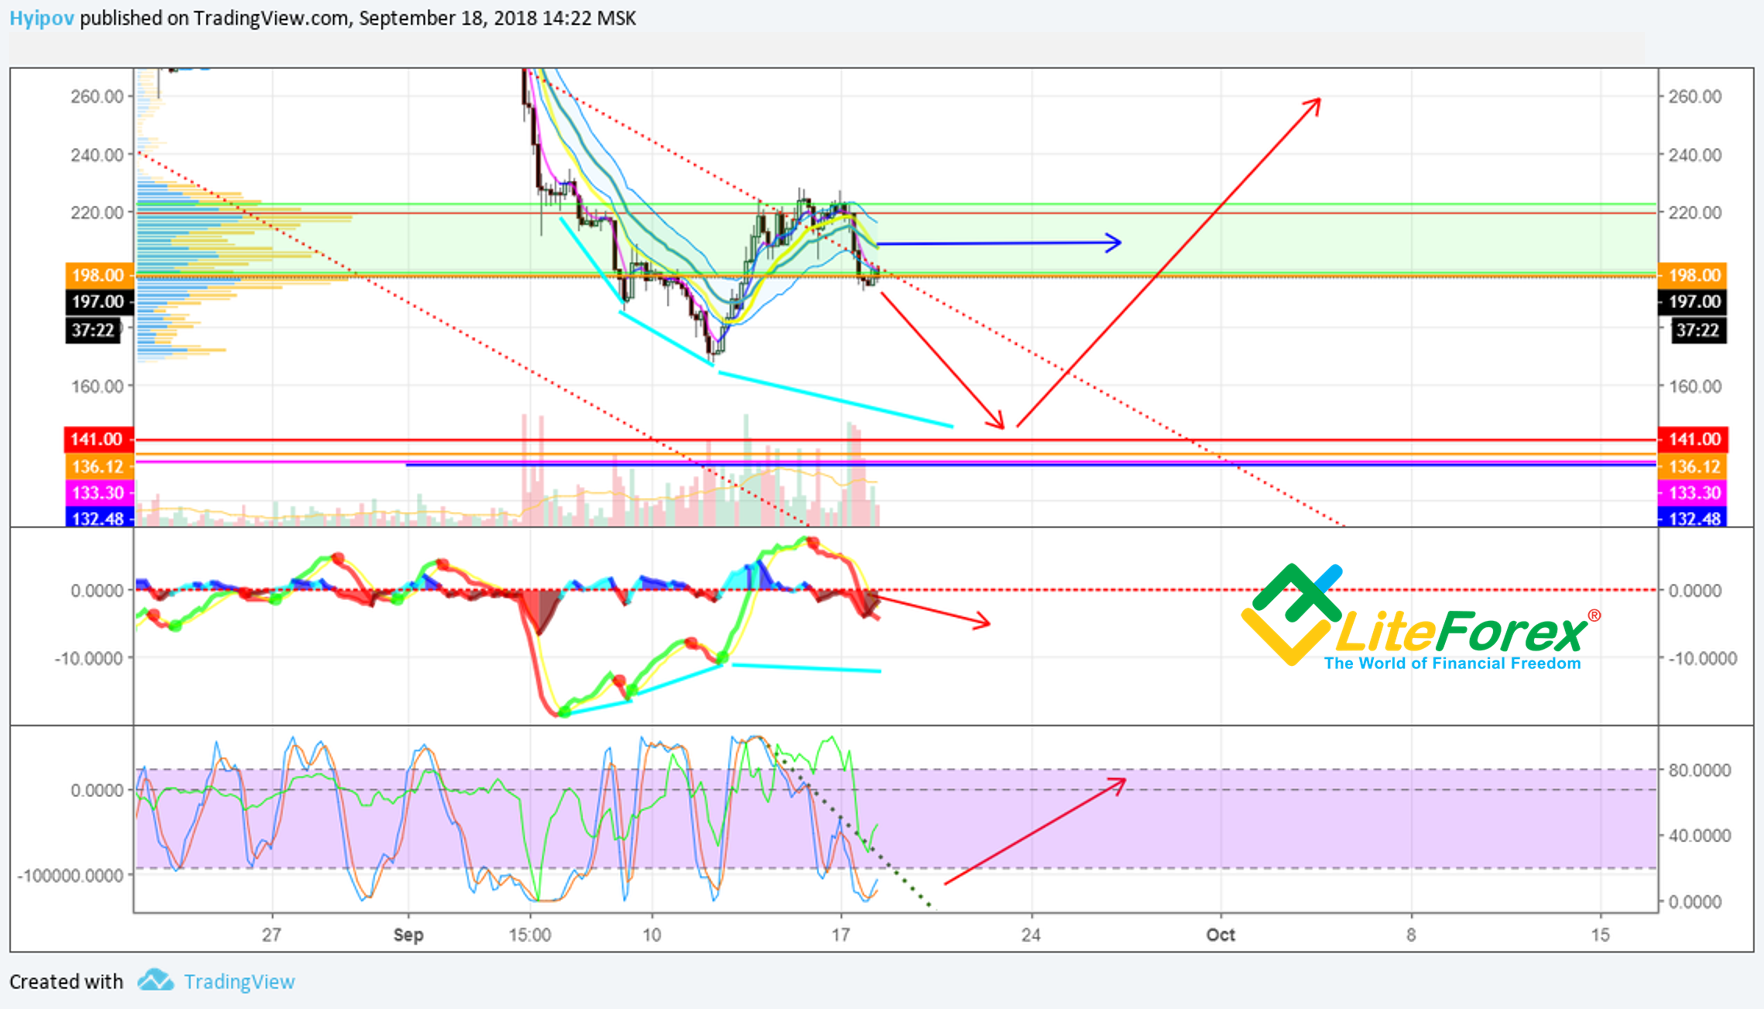
ETH/USD forecast, dated 18.09.2018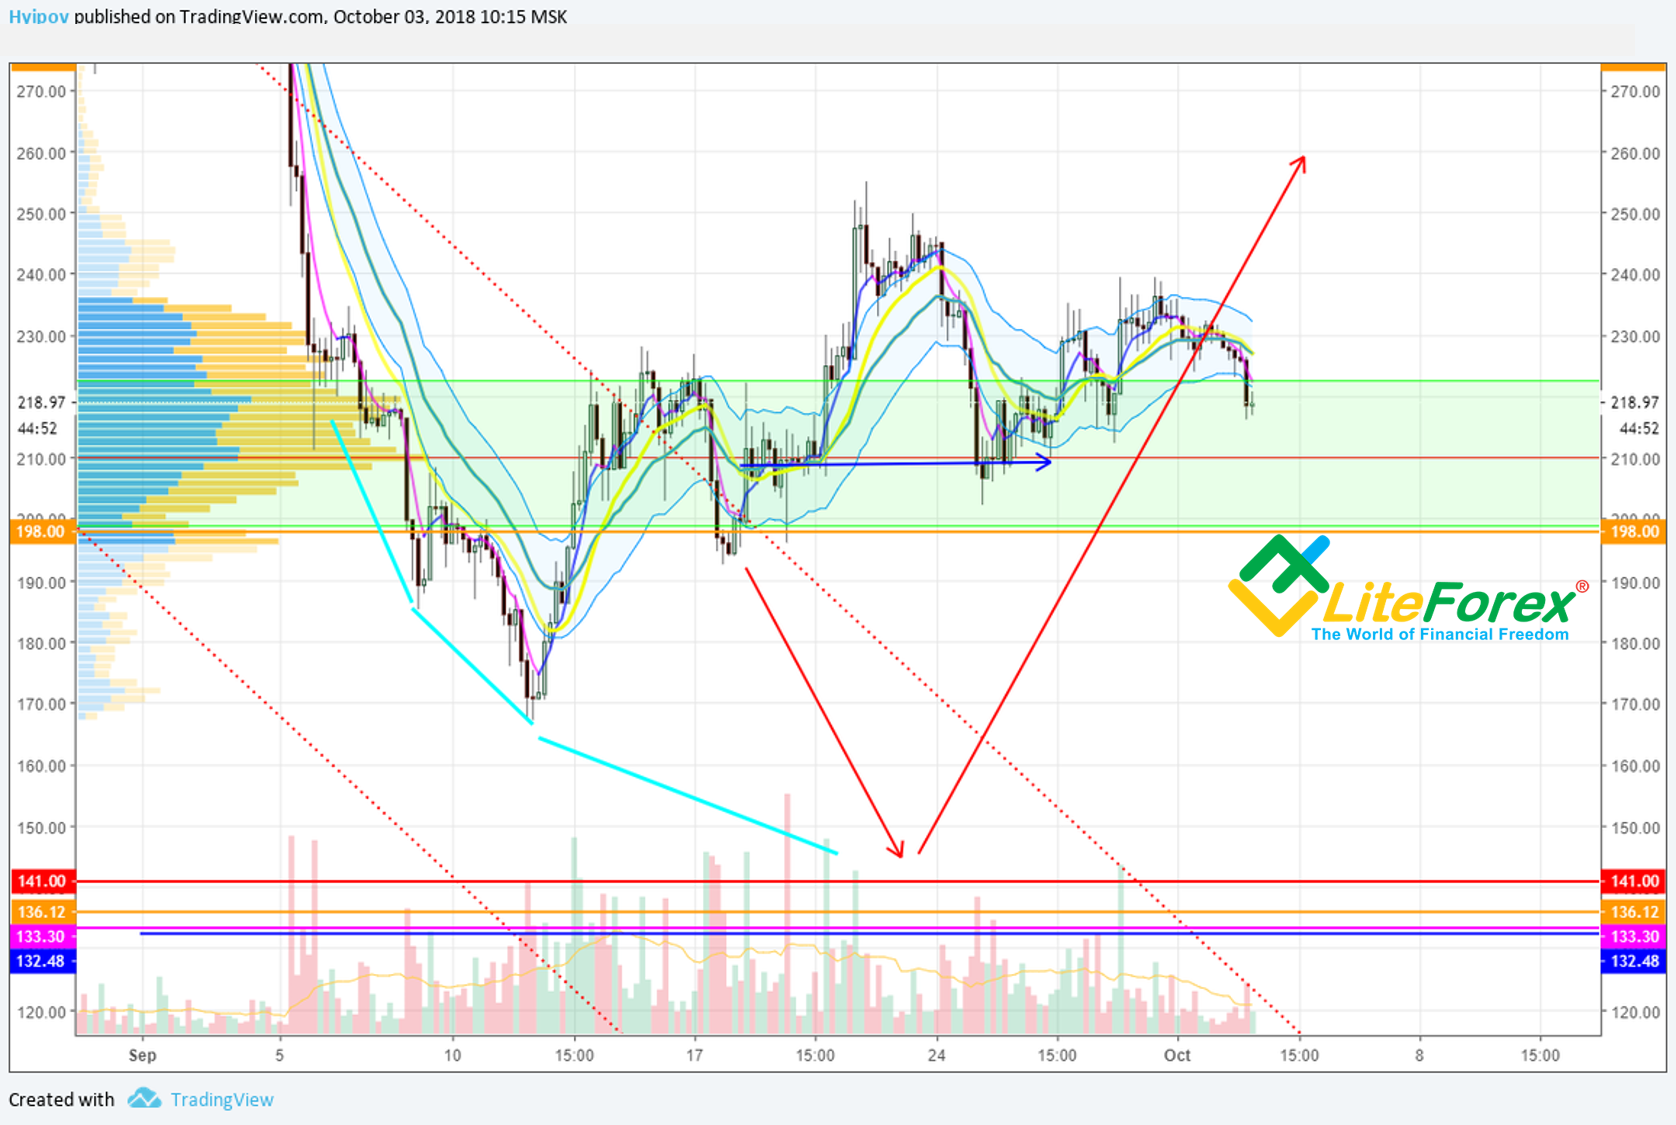
current ETH/USD situationon 03.10.2018
As it is clear from ETH USD price charts above, the ticker was going according to the second scenario and consolidated in the trading channel between 190 USD and 250 USD. This situation is not that clear as ETH price didn’t surge in the end. Instead, ETH USD is consolidating at the current level; and it doesn’t cancel the bearish scenario and ETH deeper dive.
Ethereum fundamental analysis
During the recent week, there has been no important news, able to drive Ethereum market in any direction.
In general, Ethereum fundamental situation is still rather tense, being affected by the following inside and outside factors:
- Withdrawing the funds from Ethereum
- Selling pressure by ICOs, as they are cashing out their crypto assets.
- Ethereum mining is below cost
- Constantinople hardfork is postponed
- Crypto assets are being sold, under the bankruptcy procedure against Mt.Gox
I don’t want to repeat myself, and so, I won’t describe these factors in detail again. If are not familiar with the above list, you can learn more details in my last posts, devoted to Ethereum analysis here and here (see the section Fundamental analysis)
Ethereum technical analysis
The best time for technical analysis is just after the September candlestick has closed, as it can suggest quite much information. 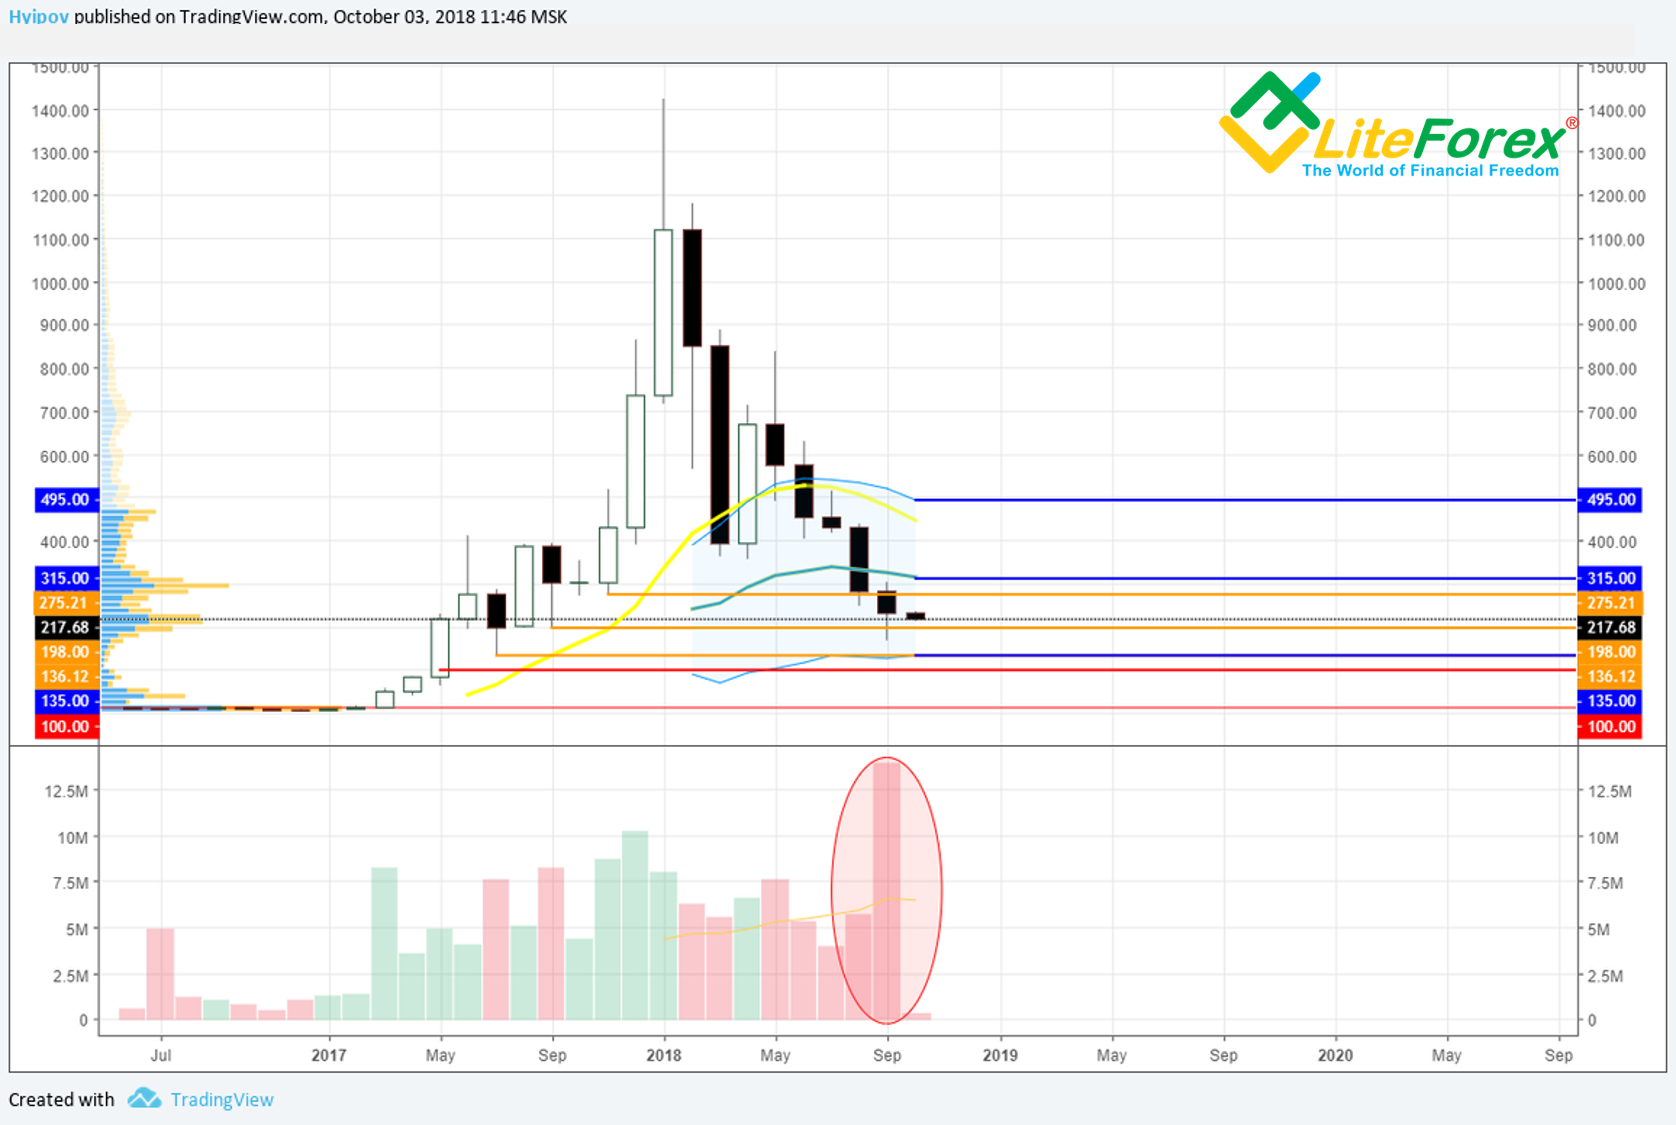
In the ETH/USD monthly chart above, you see that the trading volume is record high under the last candlestick. Besides, even though the candlestick itself is not so big, it has a long tail below.
What does it all mean? I suggest the following situation. There were strong sellers at those levels, who were dumping Ethereum at its lows and pressing ETH price down to as low as 167 USD. When ETH/USD pair reached that level, buyers were encouraged to start buying ETH out. Many bears gave up and closed ETH/USD short positions, supporting the Ethereum bullish correction.
Finally, there is something like a bullish hammer in the price chart of ETH/USD. It doesn’t matter so much what colour it is, but it is really important that it should be confirmed by the rising candlestick of the current month.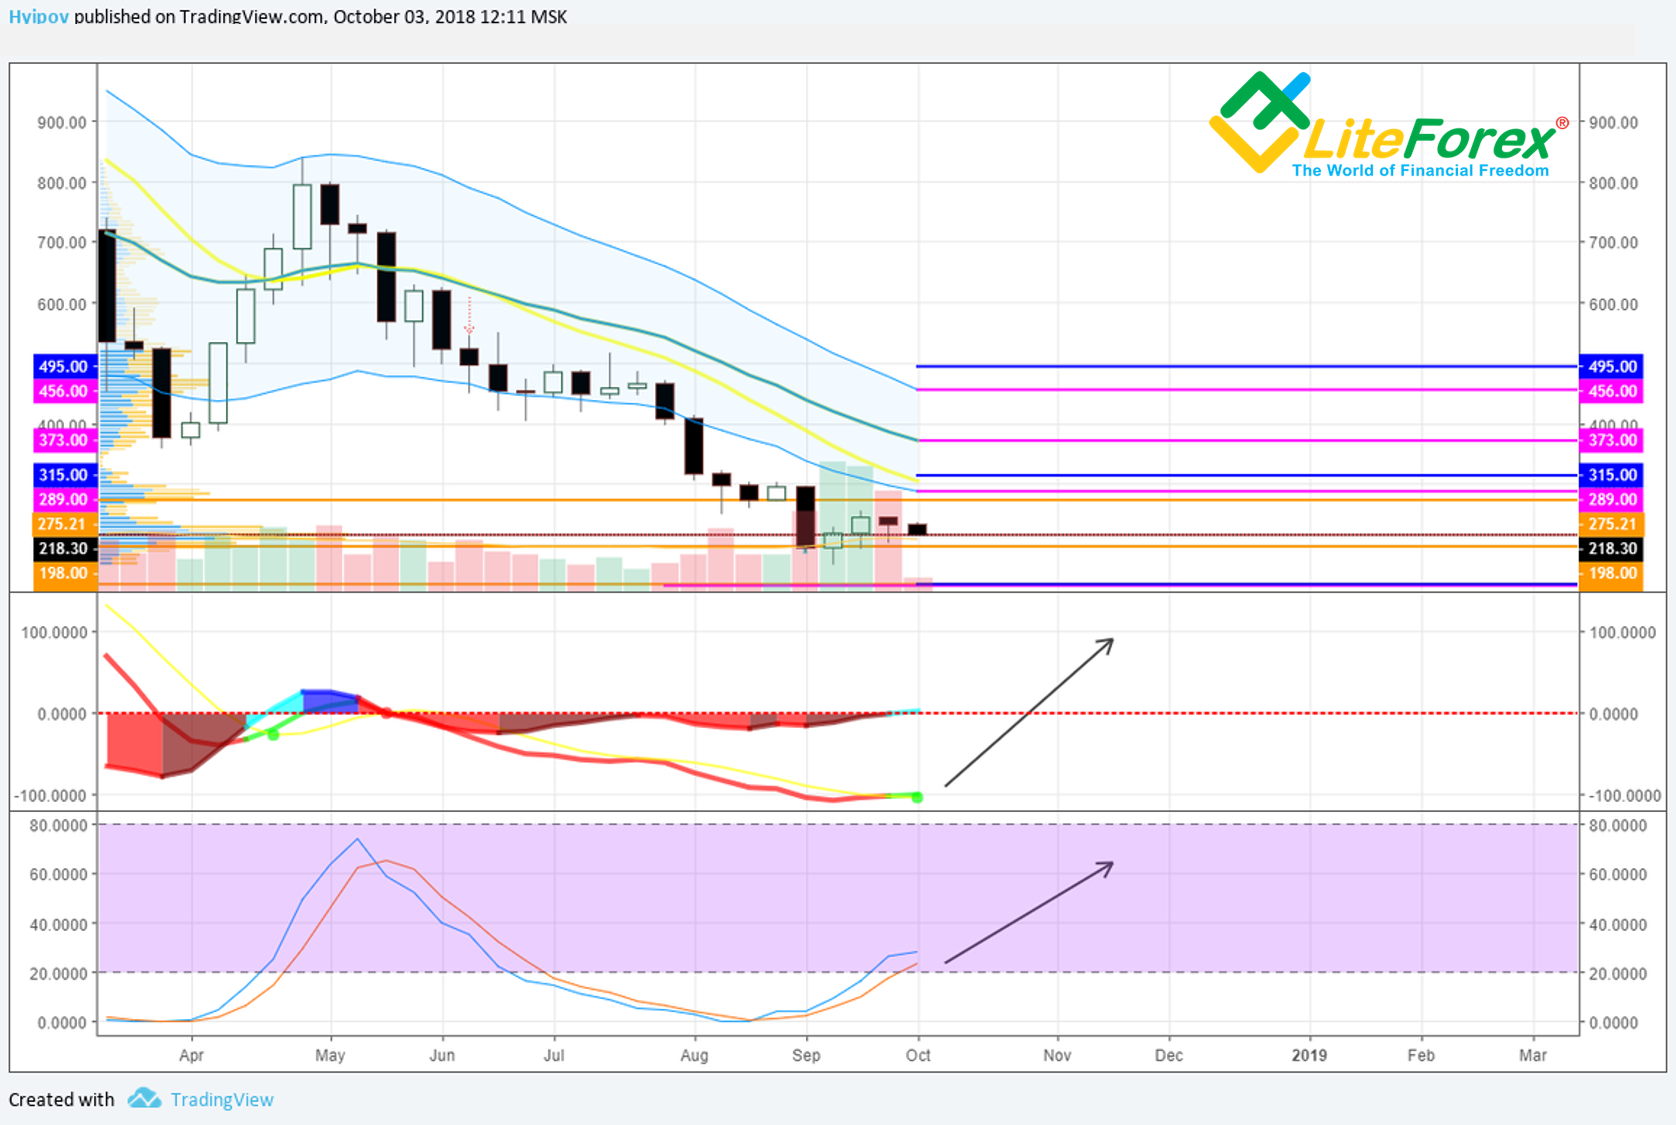
It is clear in the weekly price chart of ETH/USD pair that despite rather high volume, continuing week after week, the ETH price is not going up so high. Therefore, there are still strong buyers in the Ethereum market, who don’t let Ethereum go higher.
Nevertheless, MACD oscillators and RSI stochastic are bullish. Unfortunately, it can often be misleading, as these indicators are often late. And so, the signals may be false.
In the ETH price chart, you see that the trading channel is quite clearly outlined by two key levels; the bottom border is at 198 USD, September low, and the top one is at 275 USD, November high.
To find out whether ETH/USD ticker will go inside this channel, let’s analyze shorter timeframes.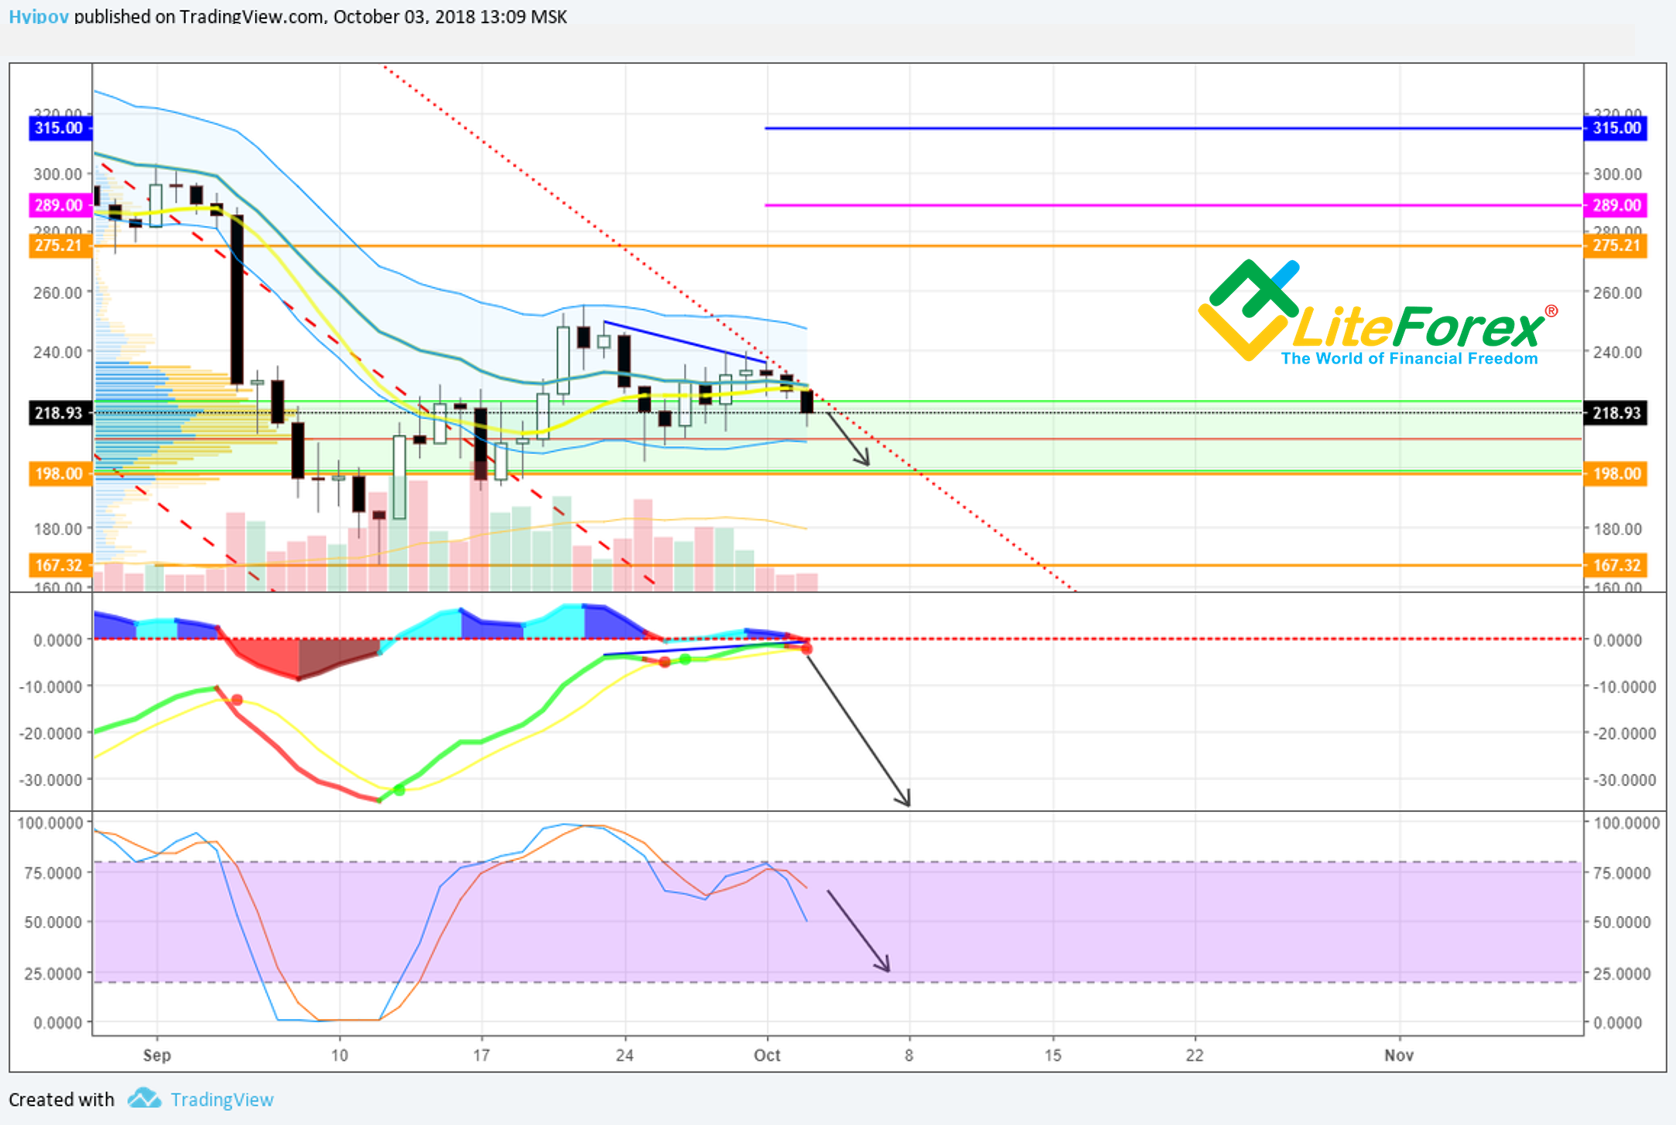
In ETH/USD daily chart above, you see that ETH/USD ticker, following some tries to rise, is rolling down towards the green support zone, drawn along the key levels of September, 2017. This level is quite strong, but its power shouldn’t be overestimated; it has been broken through once, and so, it can be broken out again. Oscillators in the Ethereum one-day chart are indicating a soon bearish correction for ETH/USD. As it is clear above, MACD is in the red zone, RSI stochastic is moving outside the overbought zone. Another element, suggesting that the correction will continue is the bearish channel projection at the distance of its length. It is clear that this line has an influence on the ticker, and so makes up a resistance for bulls and presses ETH down. In addition, there is a bearish divergence in the daily chart; I marked it with the blue lines. At the moment, the market is working out this signal, and so the pressure upon Ethereum will be maintained.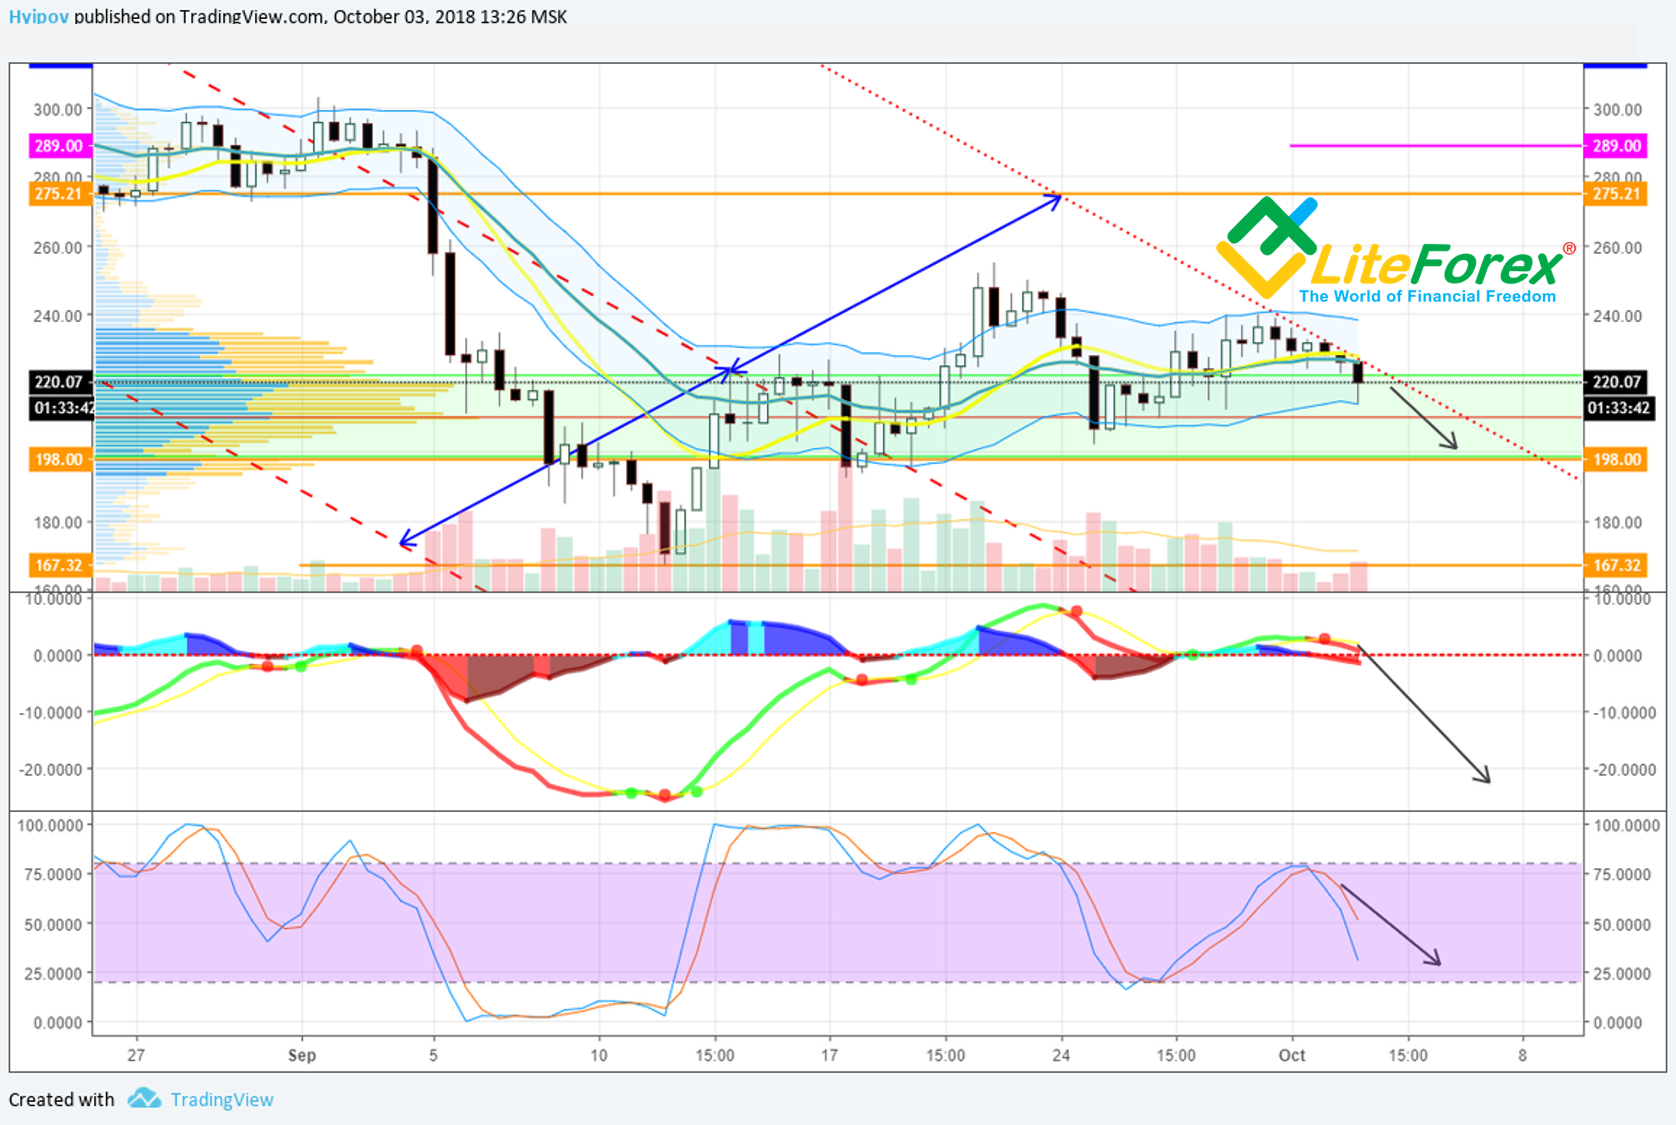
In the ETH/USD 12-hour chart, it is clearly seen that the instrument is work in out the resistance from the bearish channel projection. All the last candlesticks are just following this line.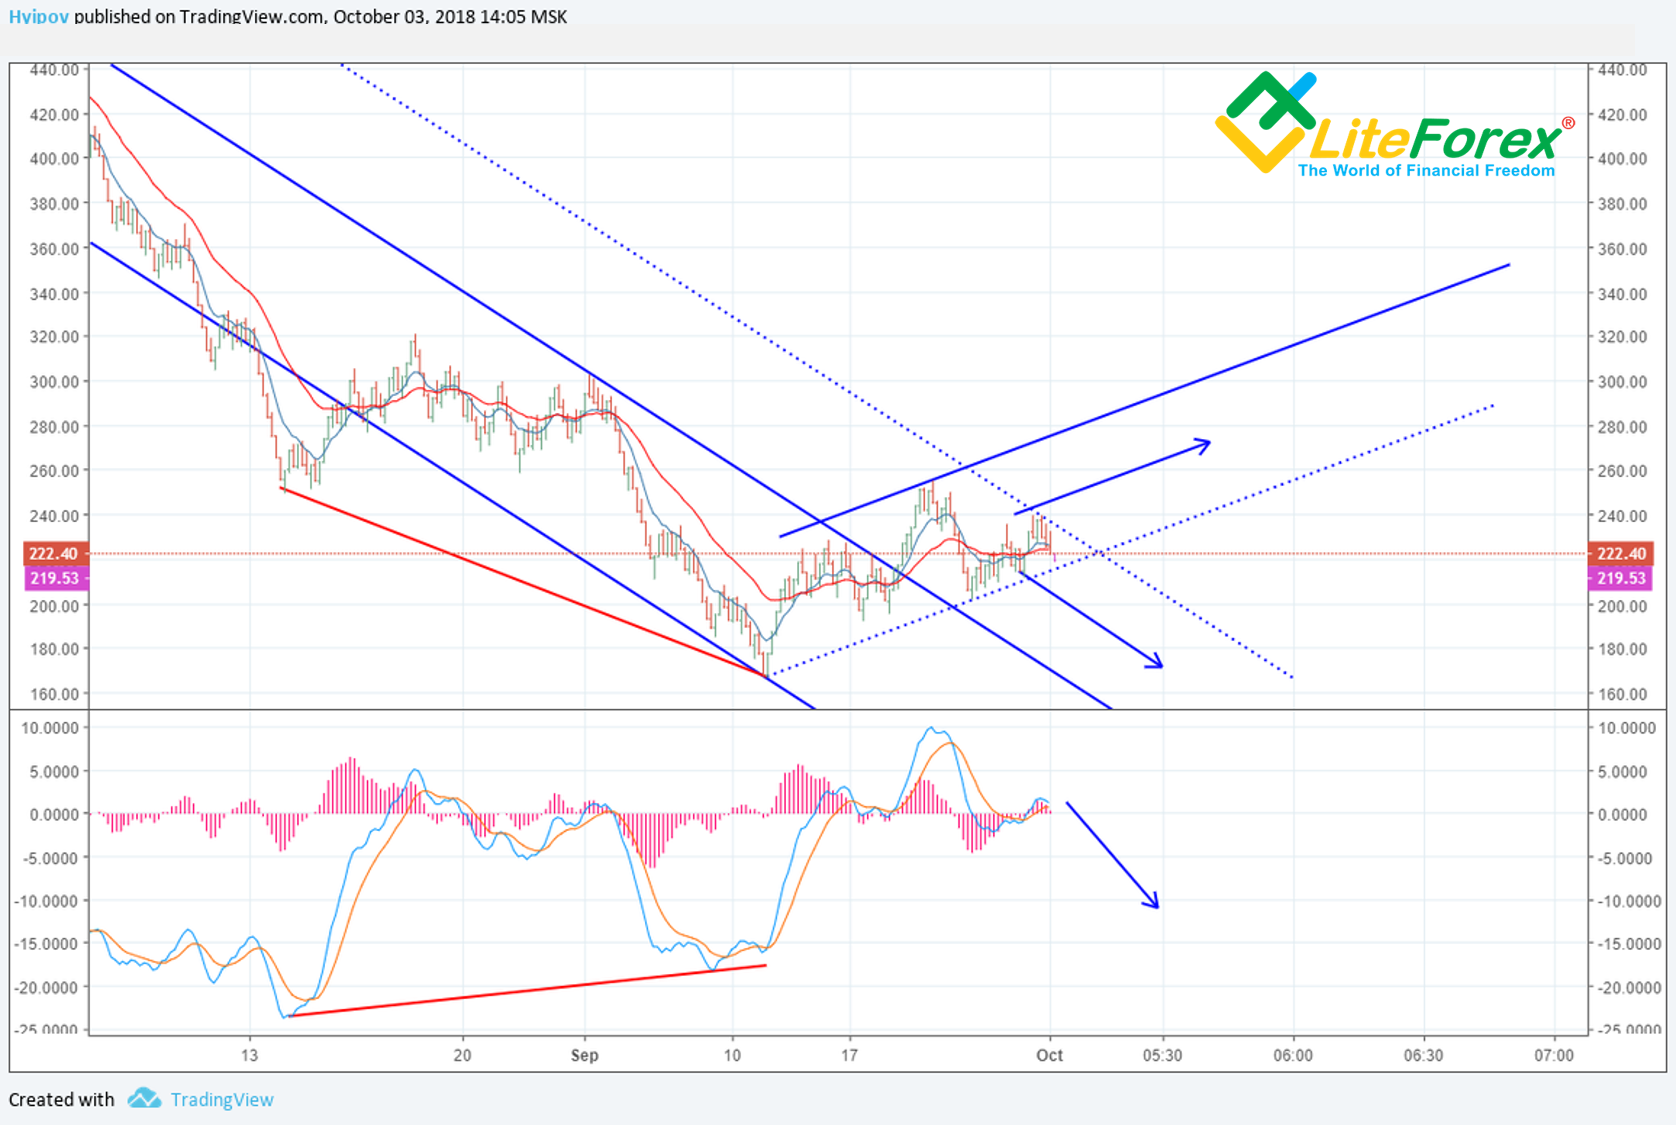
As a part of my big experiment, I shall check the rare price charts. According to Range with the price scale of 1000, the situation is not somehow clear or exact. On the one hand, there is a bullish divergence (marked with the red line); on the other hand, there is the bearish channel projection that creates the resistance. The Range bars are emerging inside the symmetric triangle; and ETH price can exit it in any direction.
If you look at the other charts, the most indicative is the Tic-Tac-Toe chart.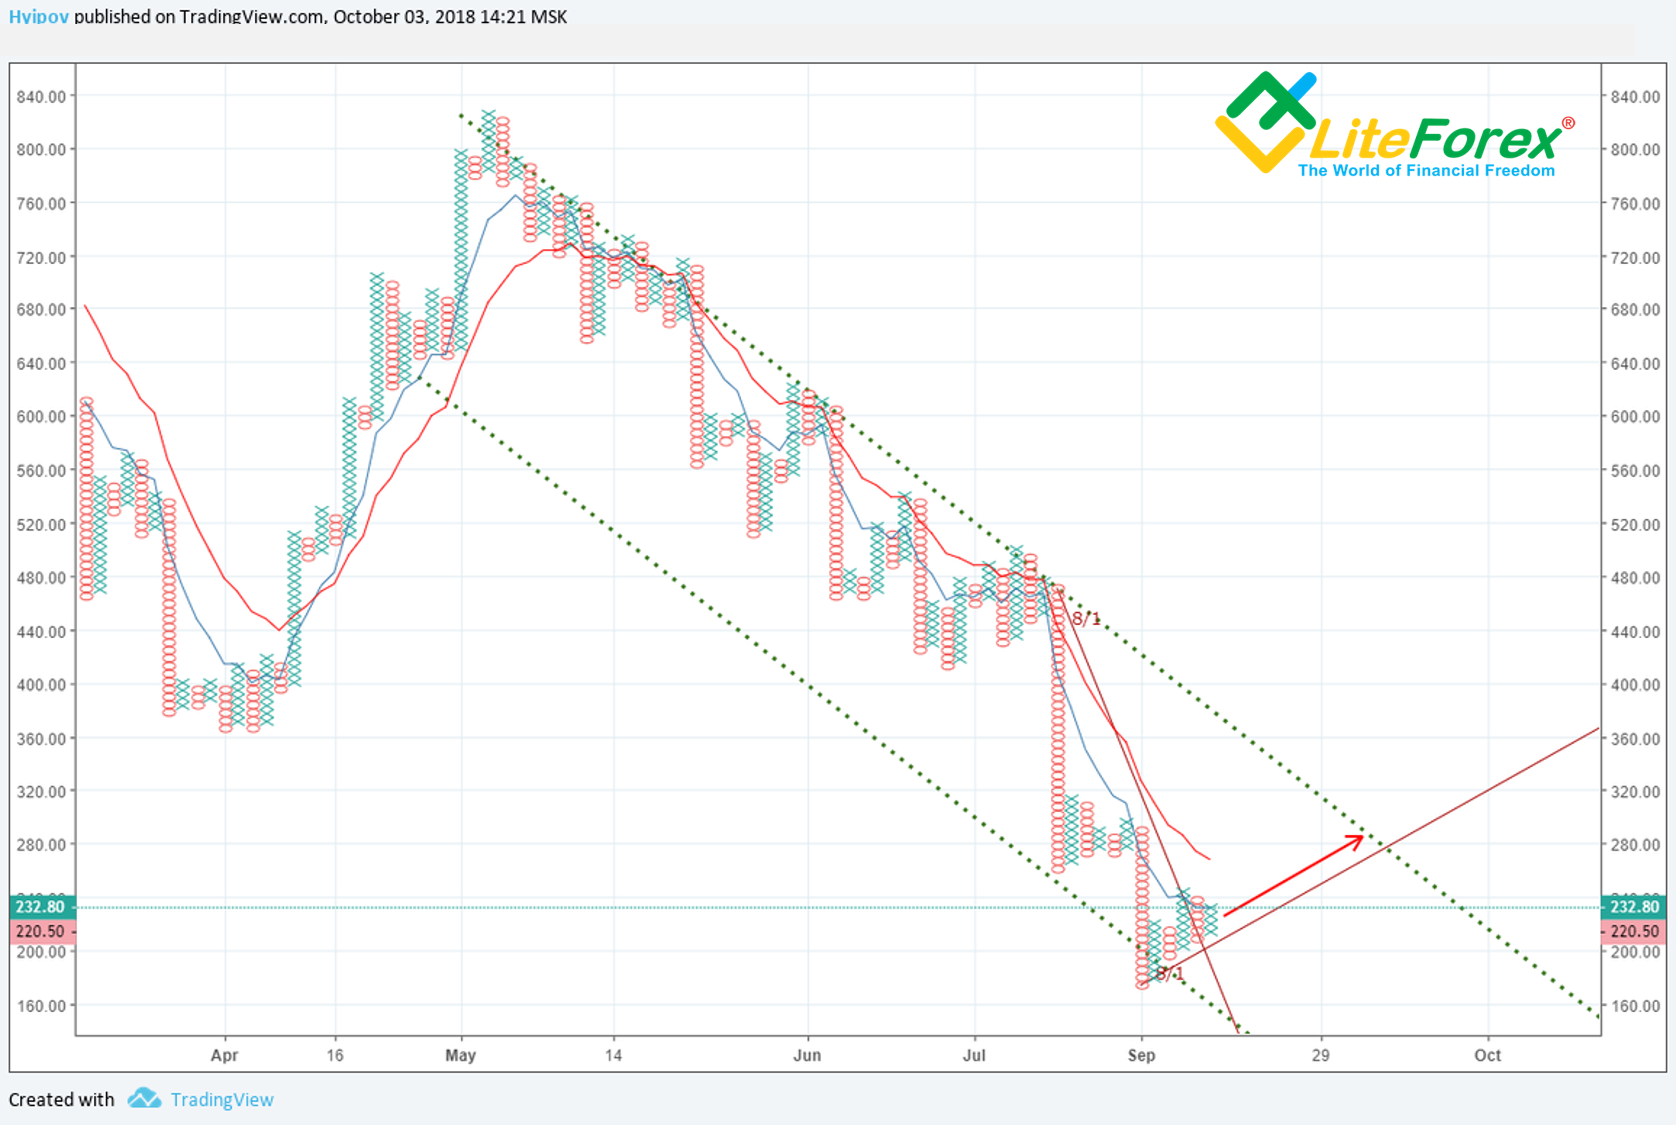
It is clear from the ETH/USD chart above that the ETH/USD ticker is still in the bearish channel. Ethereum price has rebounded from the channel bottom border and is now consolidation. If 8/1 Gann line is broken out, the downward movement will be confirmed.
Up-to-date ETH/USD price forecast
Summing up the above ETH/USD analysis of technical and fundamental factors, I can suggest the following ETH future moves.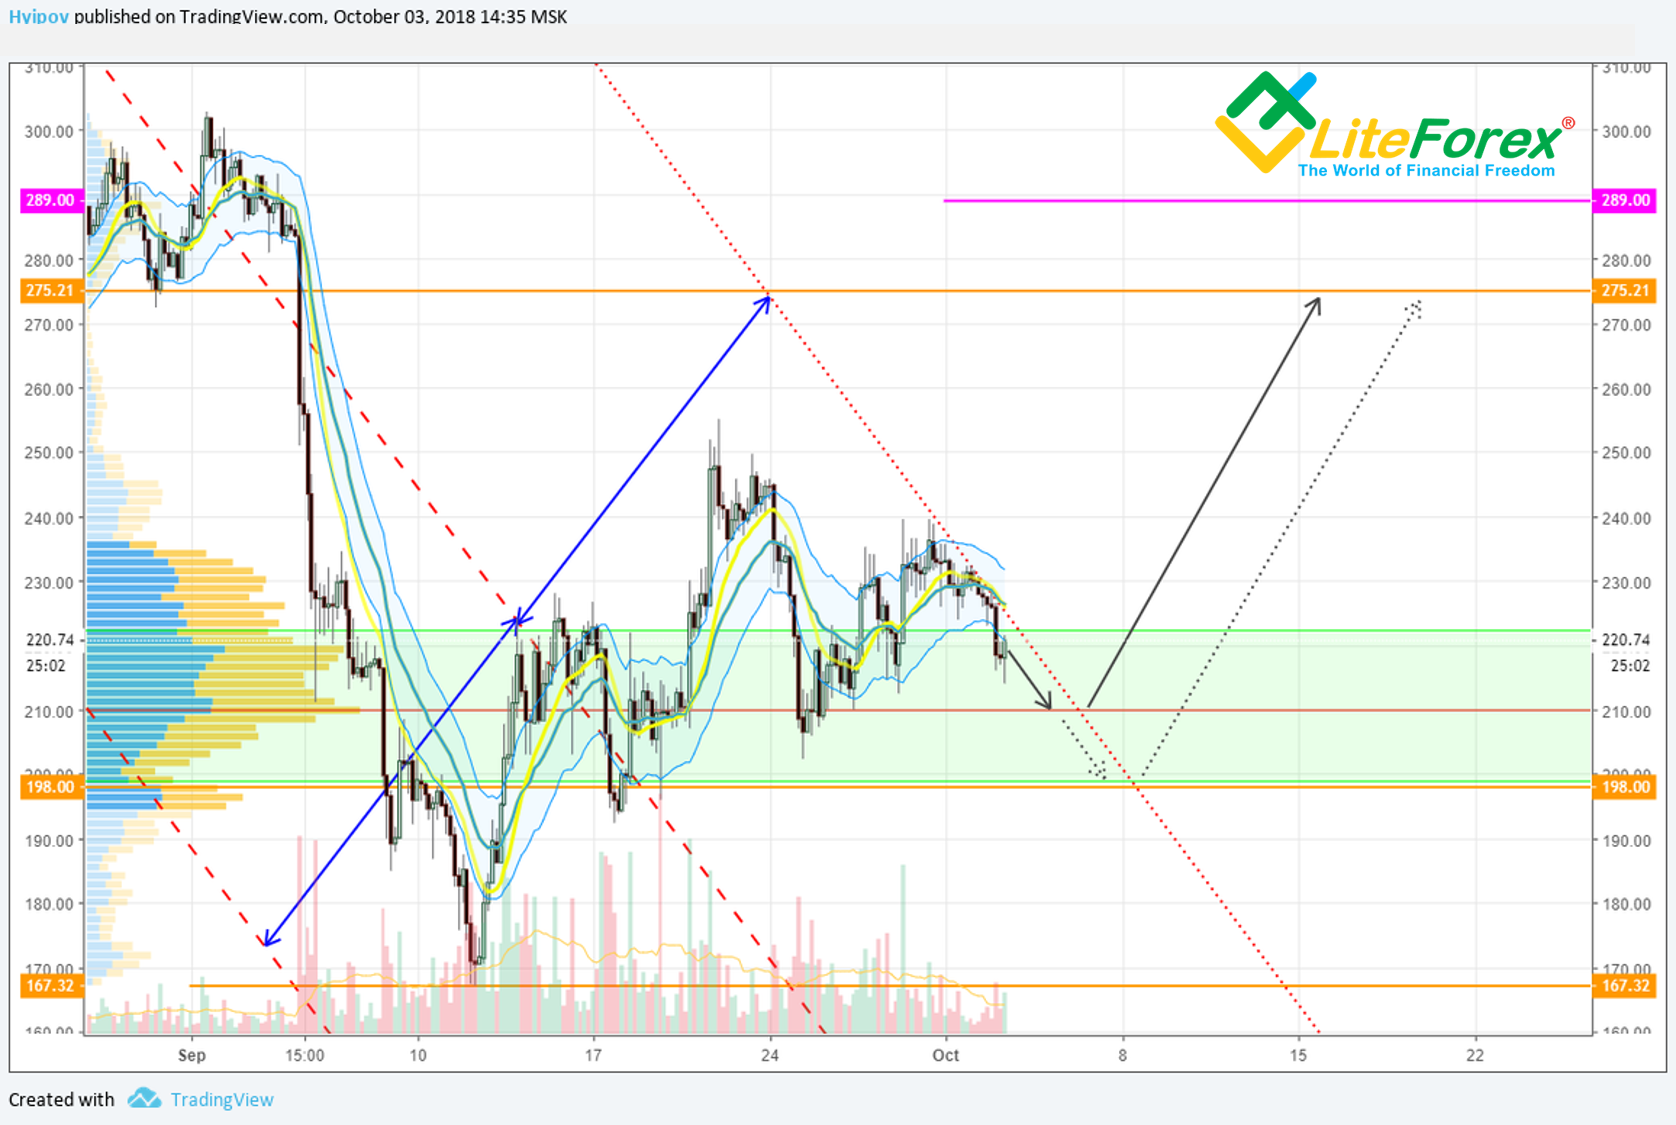
Taking into account the strong support zone at the current levels and huge volume of purchases, the ETH shouldn’t draw down lower than 200 USD– 210 USD.
The point of control in the market profile is at 210 USD, bears will hardly press ETH/USD below the level. If the projection of the bearish channel broken out, Ethereum is likely to go up inside the sideways trend. The nearest buy target is at 276 USD. I don’t think Ethereum will go higher within the next two weeks.
