
Updated ETH/USD scenario. Is Ethereum worth buying? Where will the most popular altcoin stop falling?In this post I applied the following tools: fundamental analysis, all-round market view, market balance level, volume profile, candlestick analysis, trendline analysis, oscillators.
Dear friends,
I go on my series of crypto forecasts and, today, I’d like to dwell upon Ethereum price, or, rather analyze ETH/USD.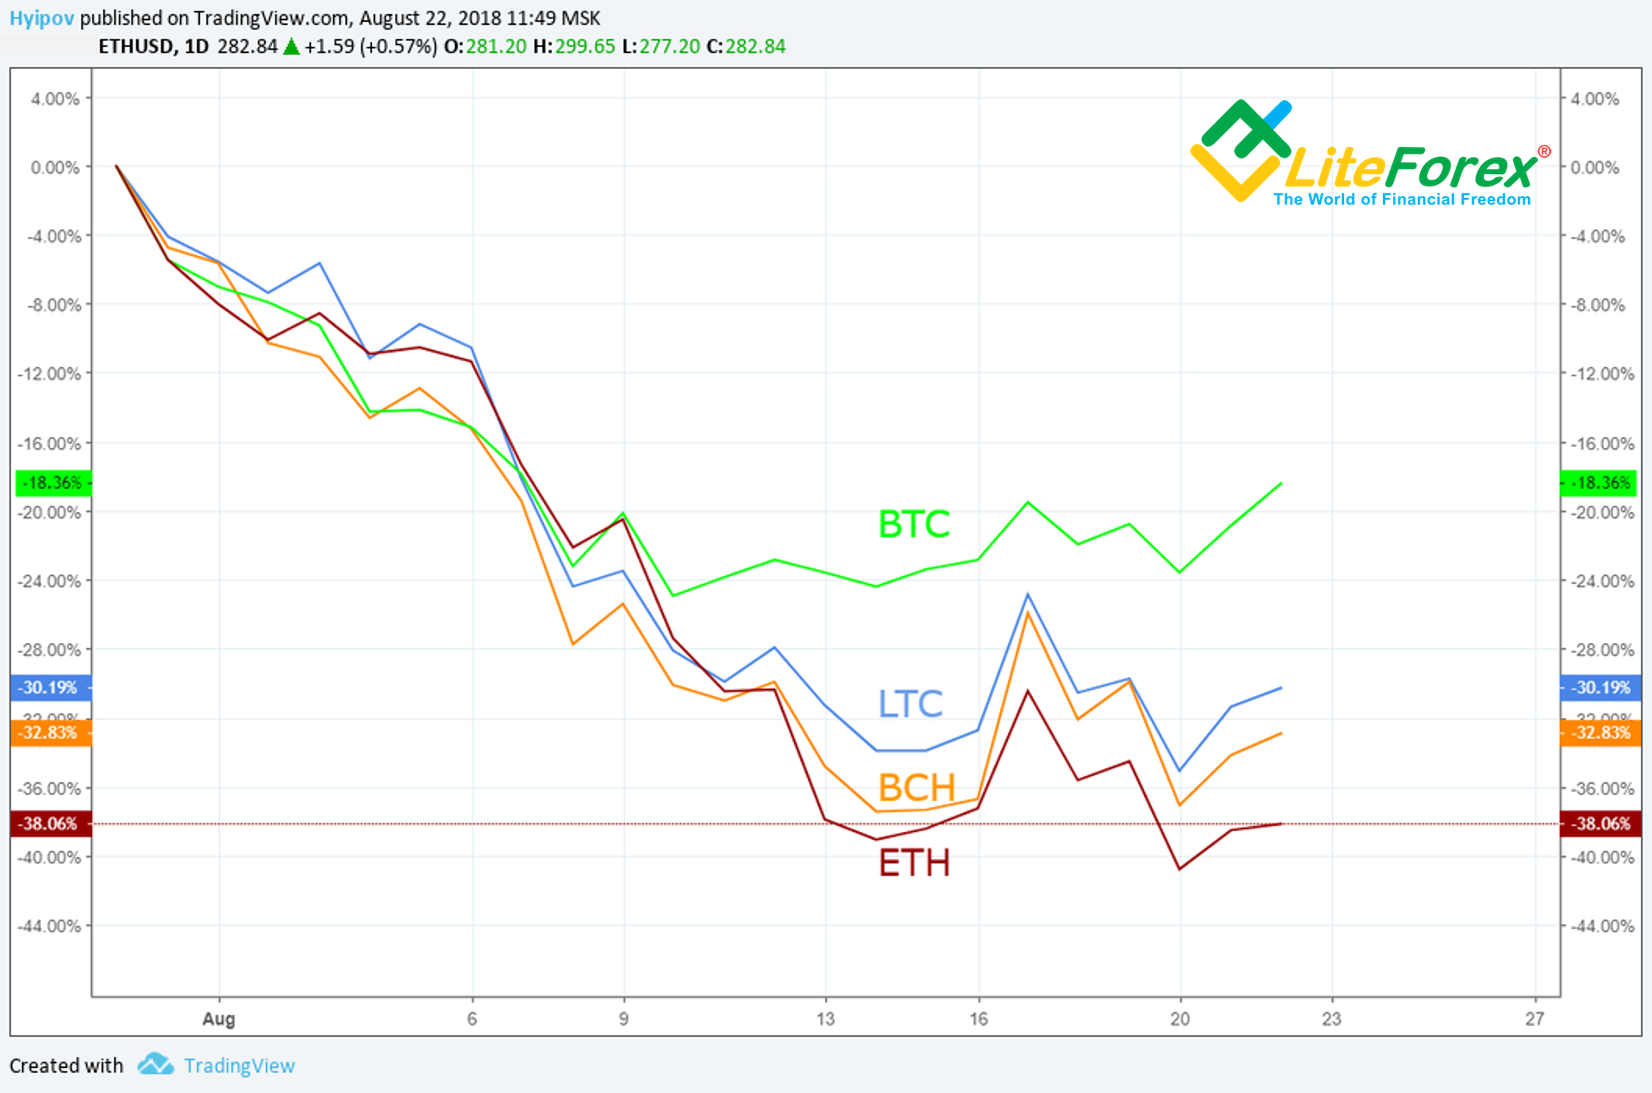
As it is clear from the joint cryptocurrency price chart above, all altcoins preform in general worse that the cryptocurrency benchmark, Bitcoin.
But even among other altcoins, Ethereum is obviously not the best. It is because of common depression in the crypto market and the Ethereum sellout by the participants of the ICO boom in 2017.
As a result of such a drop, many crypto hedge funds suffered great losses. And some of them were even considering going short for ETH. Tetras Capital is one of them. In the post Ether (ETH) Bearish Thesis, they publish three strong arguments for their bearish sentiment:
- Low capacity of Ethereum network (often network connections)
- Growing competition from alternative platforms for DApp (EOS, Lisk, ETC, NEO and others)
- Regulators’ uncertainty and the lack of complete legal base
Another blow on Ethereum was delivered by Arthur Hayes (co-Founder and CEO of BitMEX). On August 14, he called in ETH a “shitcoin” in his digest (see here), saying it isn’t worth more than 100 USD.
Of course, 100 USD is still too pessimistic, but let’s try to find out the real situation for the cryptocurrency now by means of technical analysis.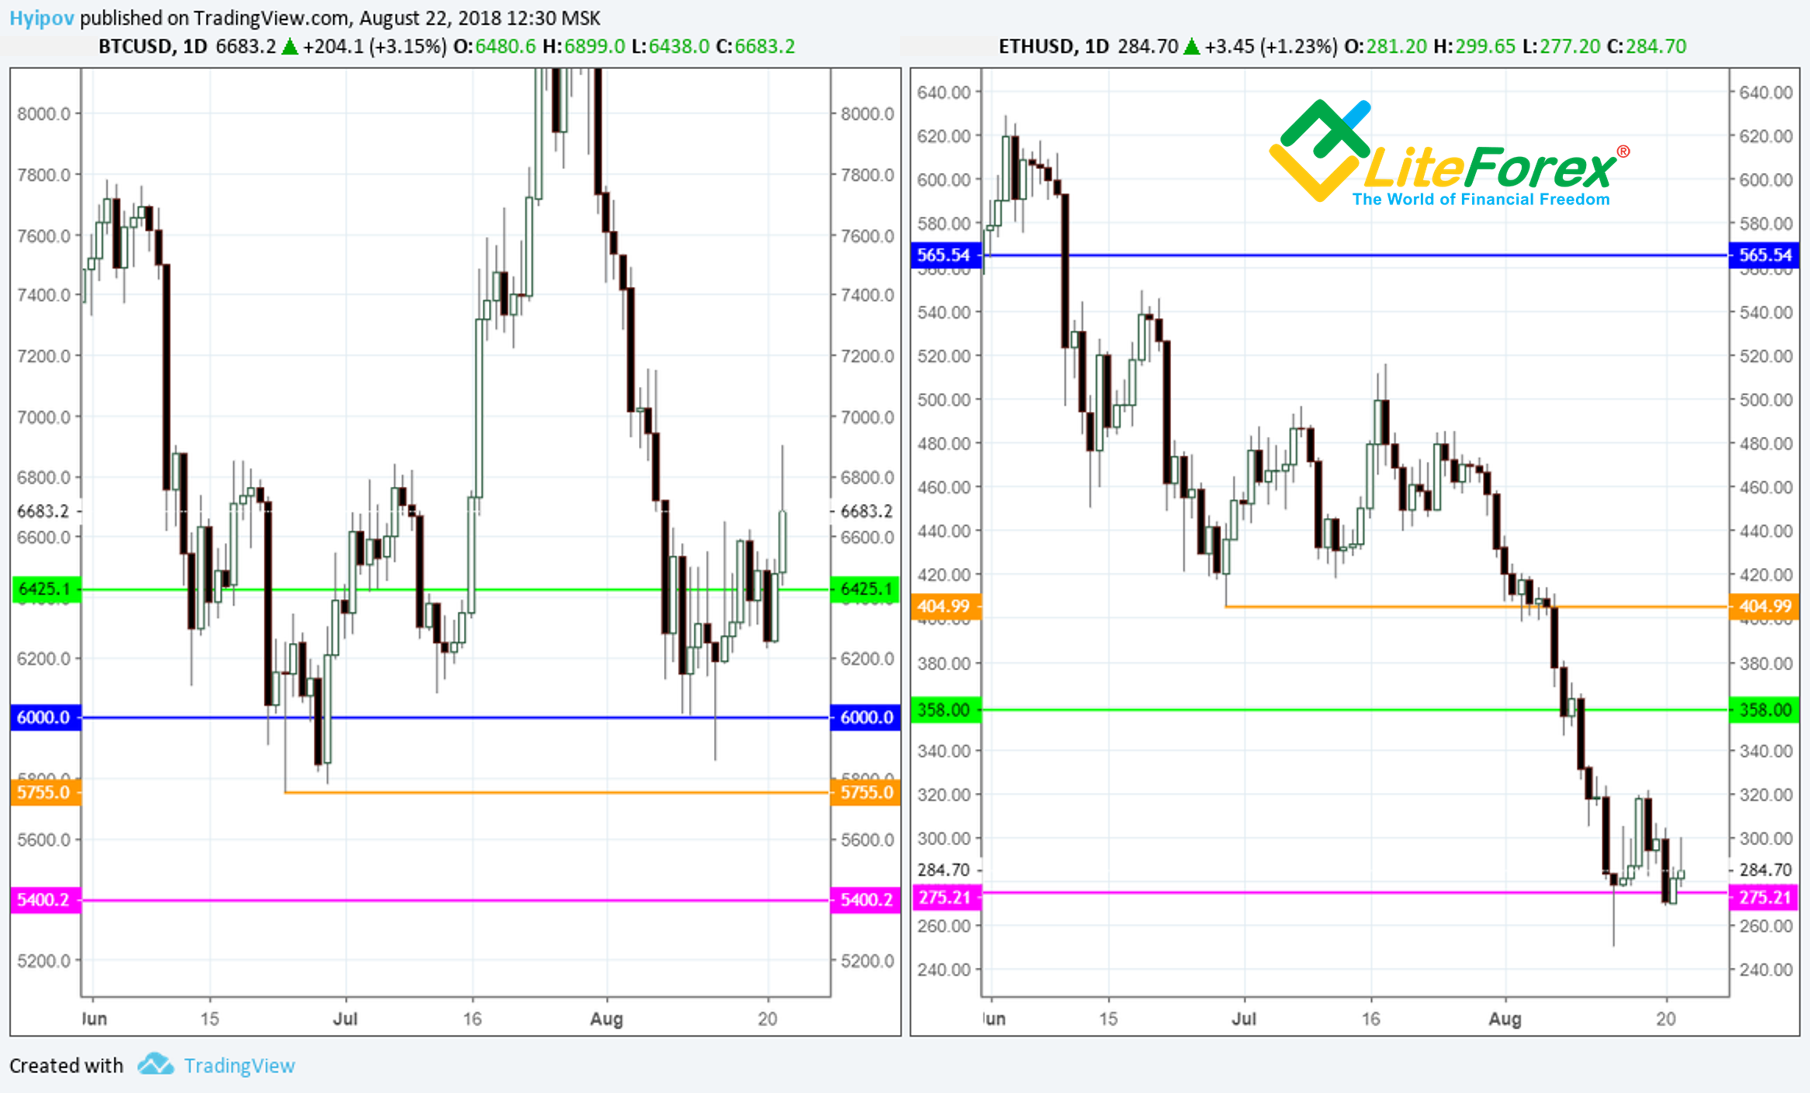
In the ETH/USD price chart above, you see that Ethereum is now in a real trouble. At the moment, ETH/USD is trading close to the support level at 275 USD (in the right chart). The corresponding level for BTCUSD is around 5400. It means that Ethereum is trading 20% down, compared to the market, and you mustn’t underestimate the importance of the current support level. Below this level, the next Ethereum support zone is only at 200 USD (see the chart below).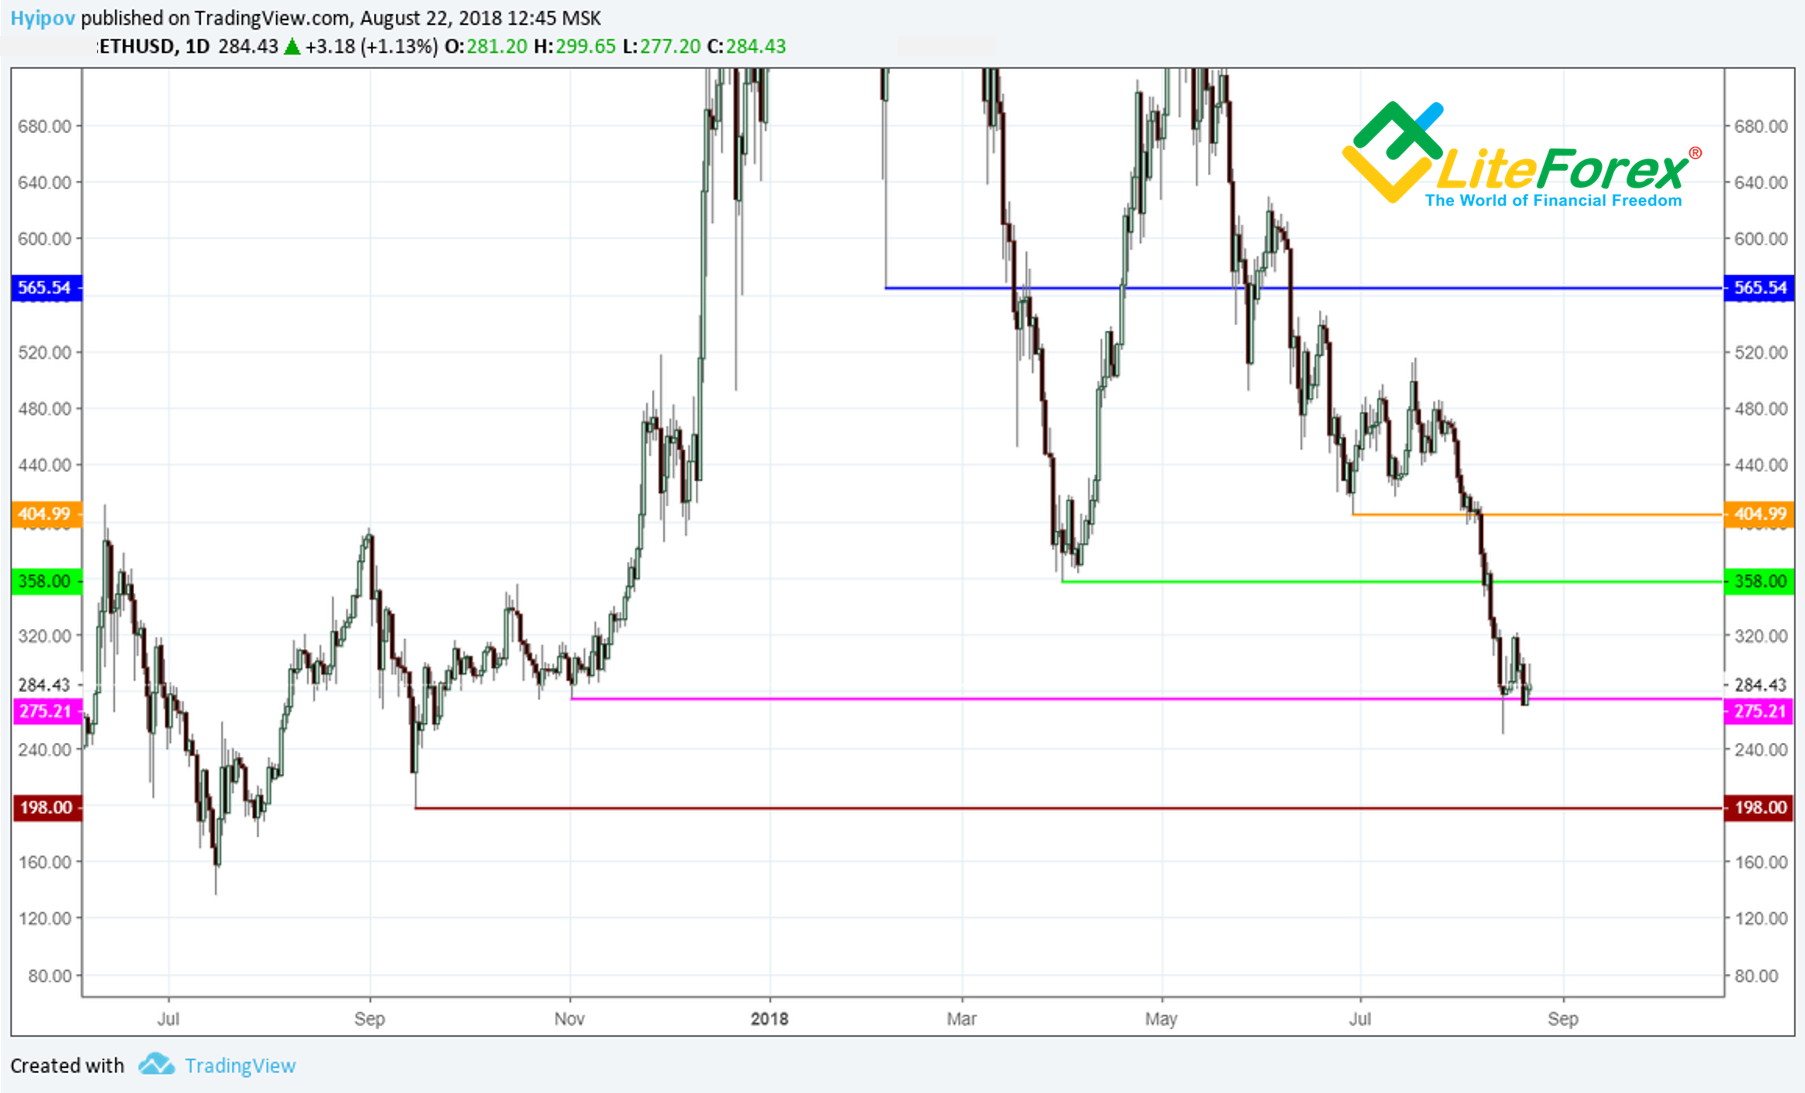
To figure out where Ethereum price will go next, let’s carry out all-round market view and apply technical analysis.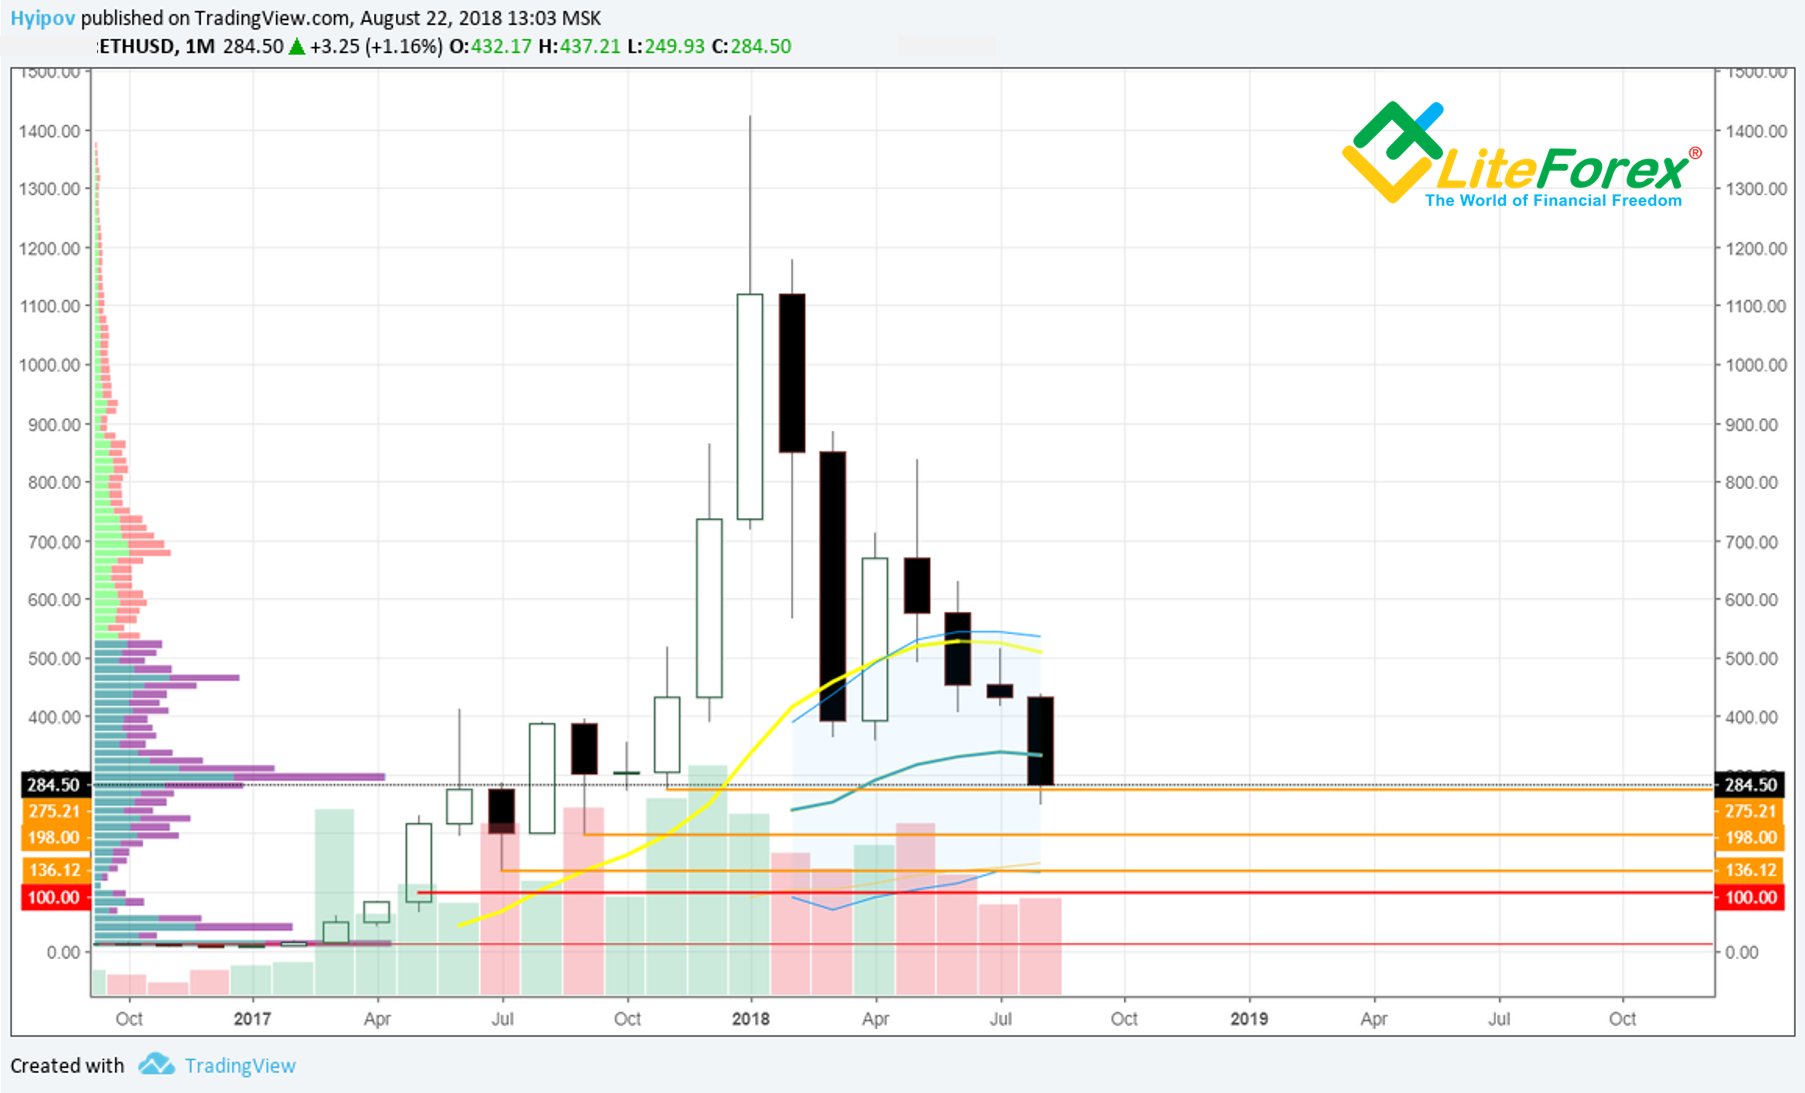
As you see from the chart above, August monthly candlestick has penetrated level 275 USD. The candlestick itself has a long black body. Unless Ethereum price doesn’t rebound to the level around 400 USD before the end of the month, there will be a strong bearish candlestick in the Ethereum monthly timeframe, which should be followed, in the most positive scenario, by a doji, that is a sideways trend; and in the worst possible case, Ethereum will continue falling down towards 198 USD - 136 USD.
Based on this scenario, Hayes’s forecast of 100 USD for Ethereum price (I marked it with the red line in the chart above) doesn’t already seem so unreal. However, to find out a clearer future outlook, let’s analyze the shorter timeframes.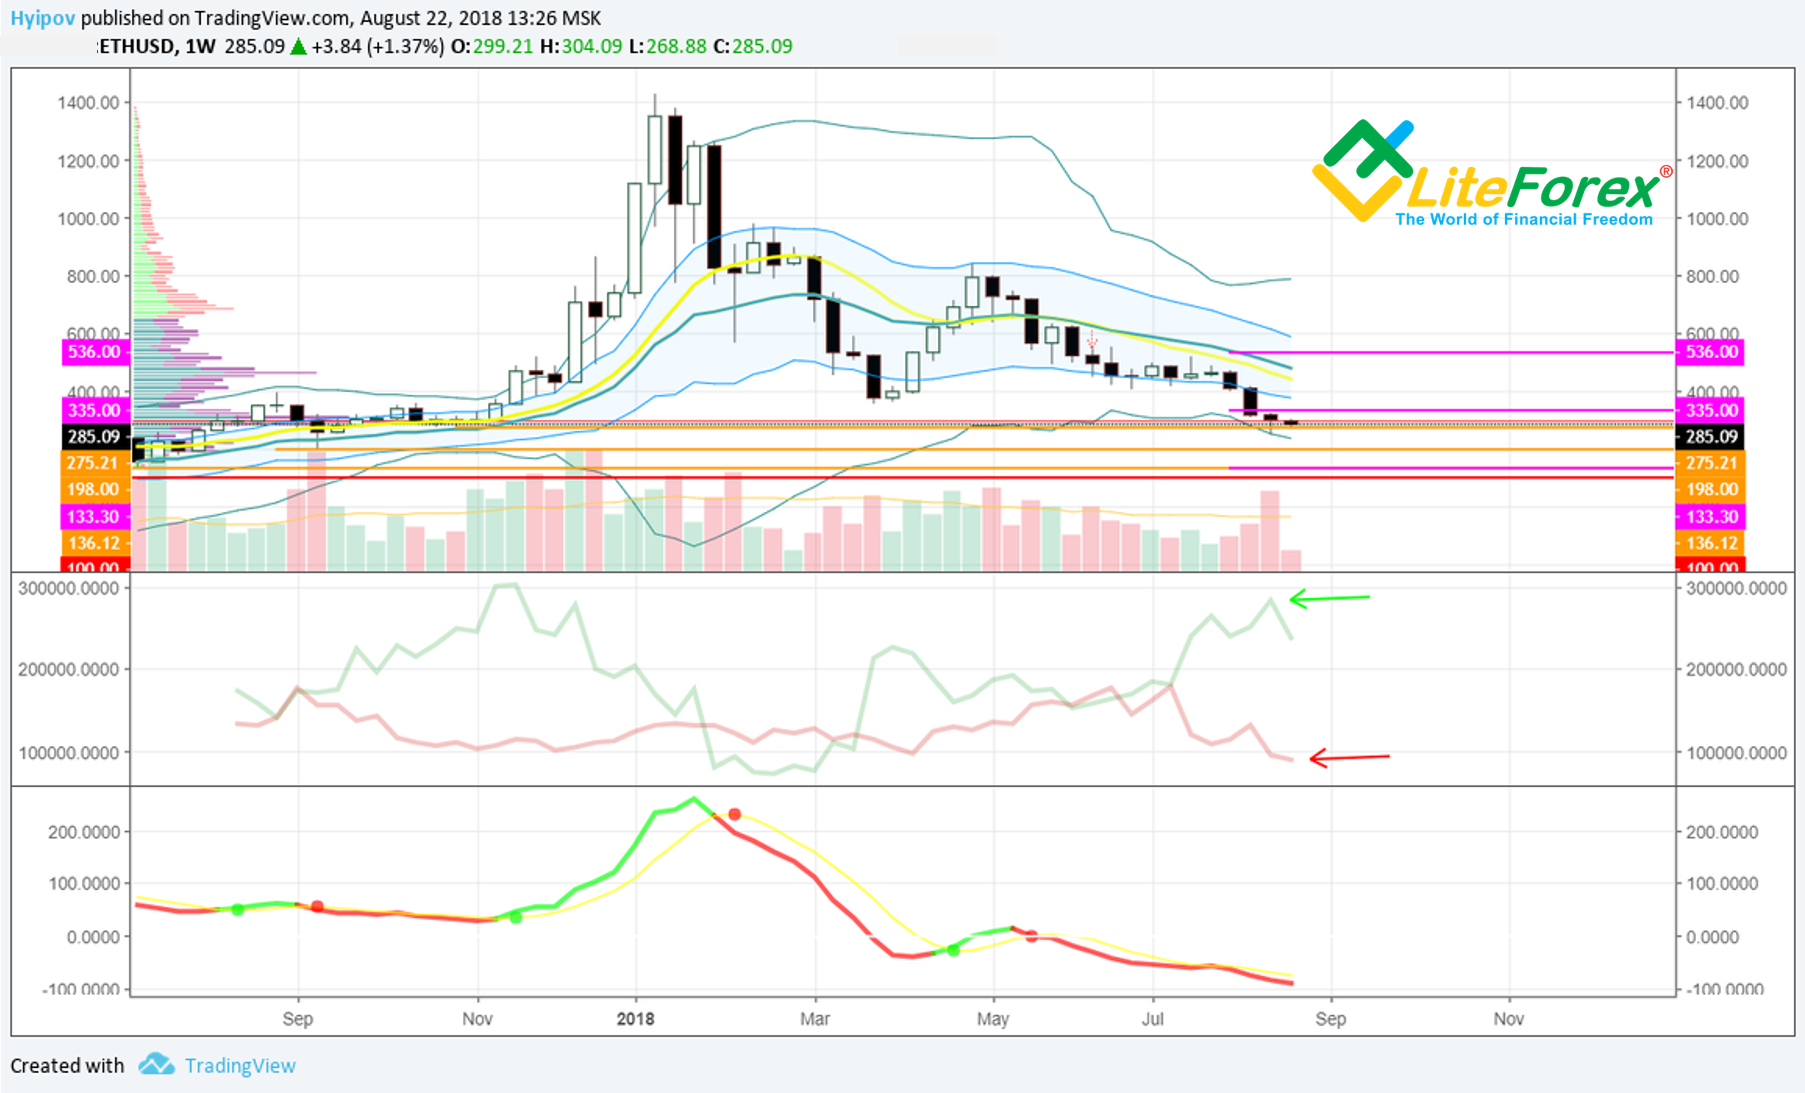
As you see from ETH/USD weekly chart, ETH/USD ticker features the high, made up by pending buy orders (the green arrow), and the low, suggested, by shorts (the red arrow).
This situation in the bearish market suggests that the trend is likely to reverse and can be explained by the fact that Ethereum price reached the level, where bears won’t risk to go short, and bulls are trying to consolidate, accumulating pending orders at the key levels, counting on the price rebound.
For manipulators, it makes no sense to press the market down now, as their entire dump will be suppressed and, in the end, it will just help greedy bulls stock up at lows, before another price surge.
To avoid it, manipulators are likely to organize a pump in order to prevent the majority of limit orders from working out and joining the upward flight.
In Ethereum weekly chart, MACD is still in the red zone, but it has gone rather deep already, emphasizing that the instrument is oversold. Nevertheless, I don’t yet see any clear reversal signals, and so, ETH/USD is going to trade down for some time.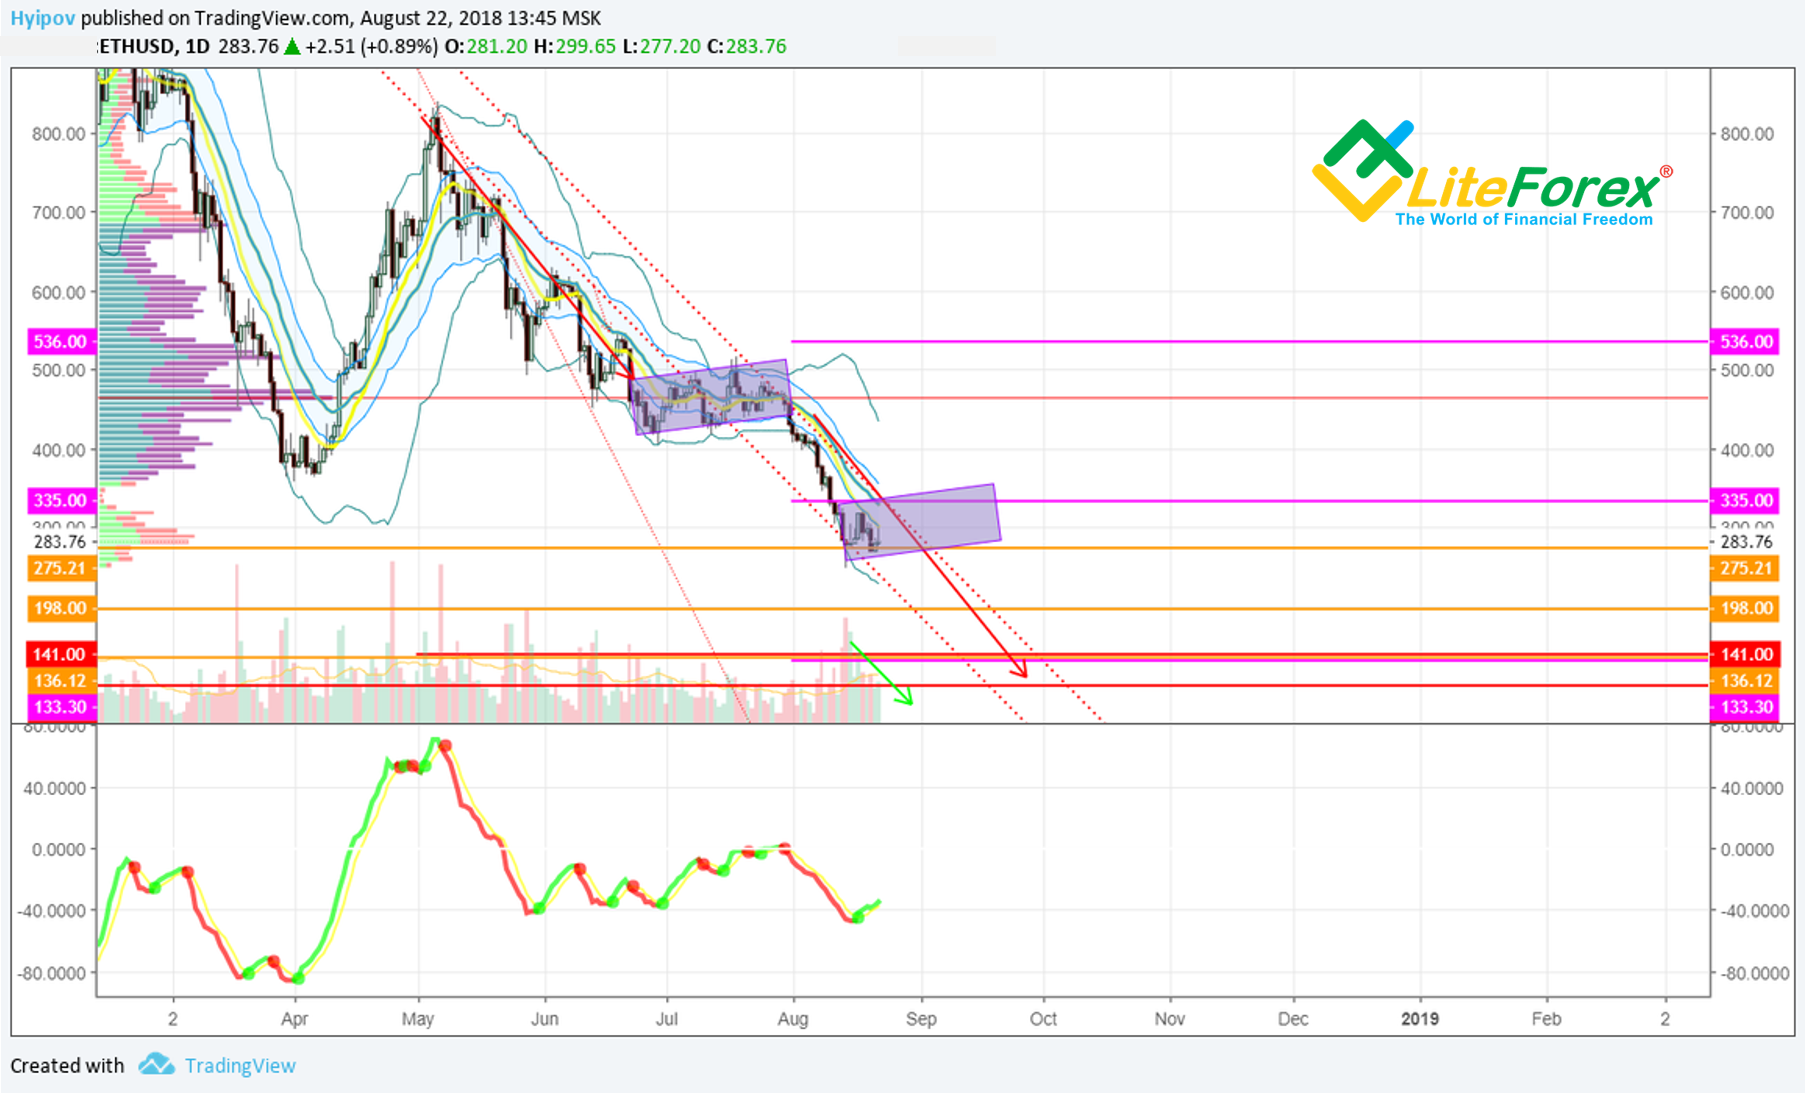
In ETH/USD daily chart above, you see that the ticker is in the bearish channel; the moving inside was stopped by a short consolidation, looking like a flag (the blue box). The channel breakout from above marked the target for the flag pattern, which is at the distance, equal to the flagpole, at around 136 USD.
At the present moment, MACD is sending a green signal that may start the price consolidation, developing another little flag.
Remember, as an experiment, I analyze different chart types on the example of popular trading instruments, applying classical indicators to them (learn more here).
The first chart type to explore is Renko. I should say it proves to be quite efficient for ETH/USD pair.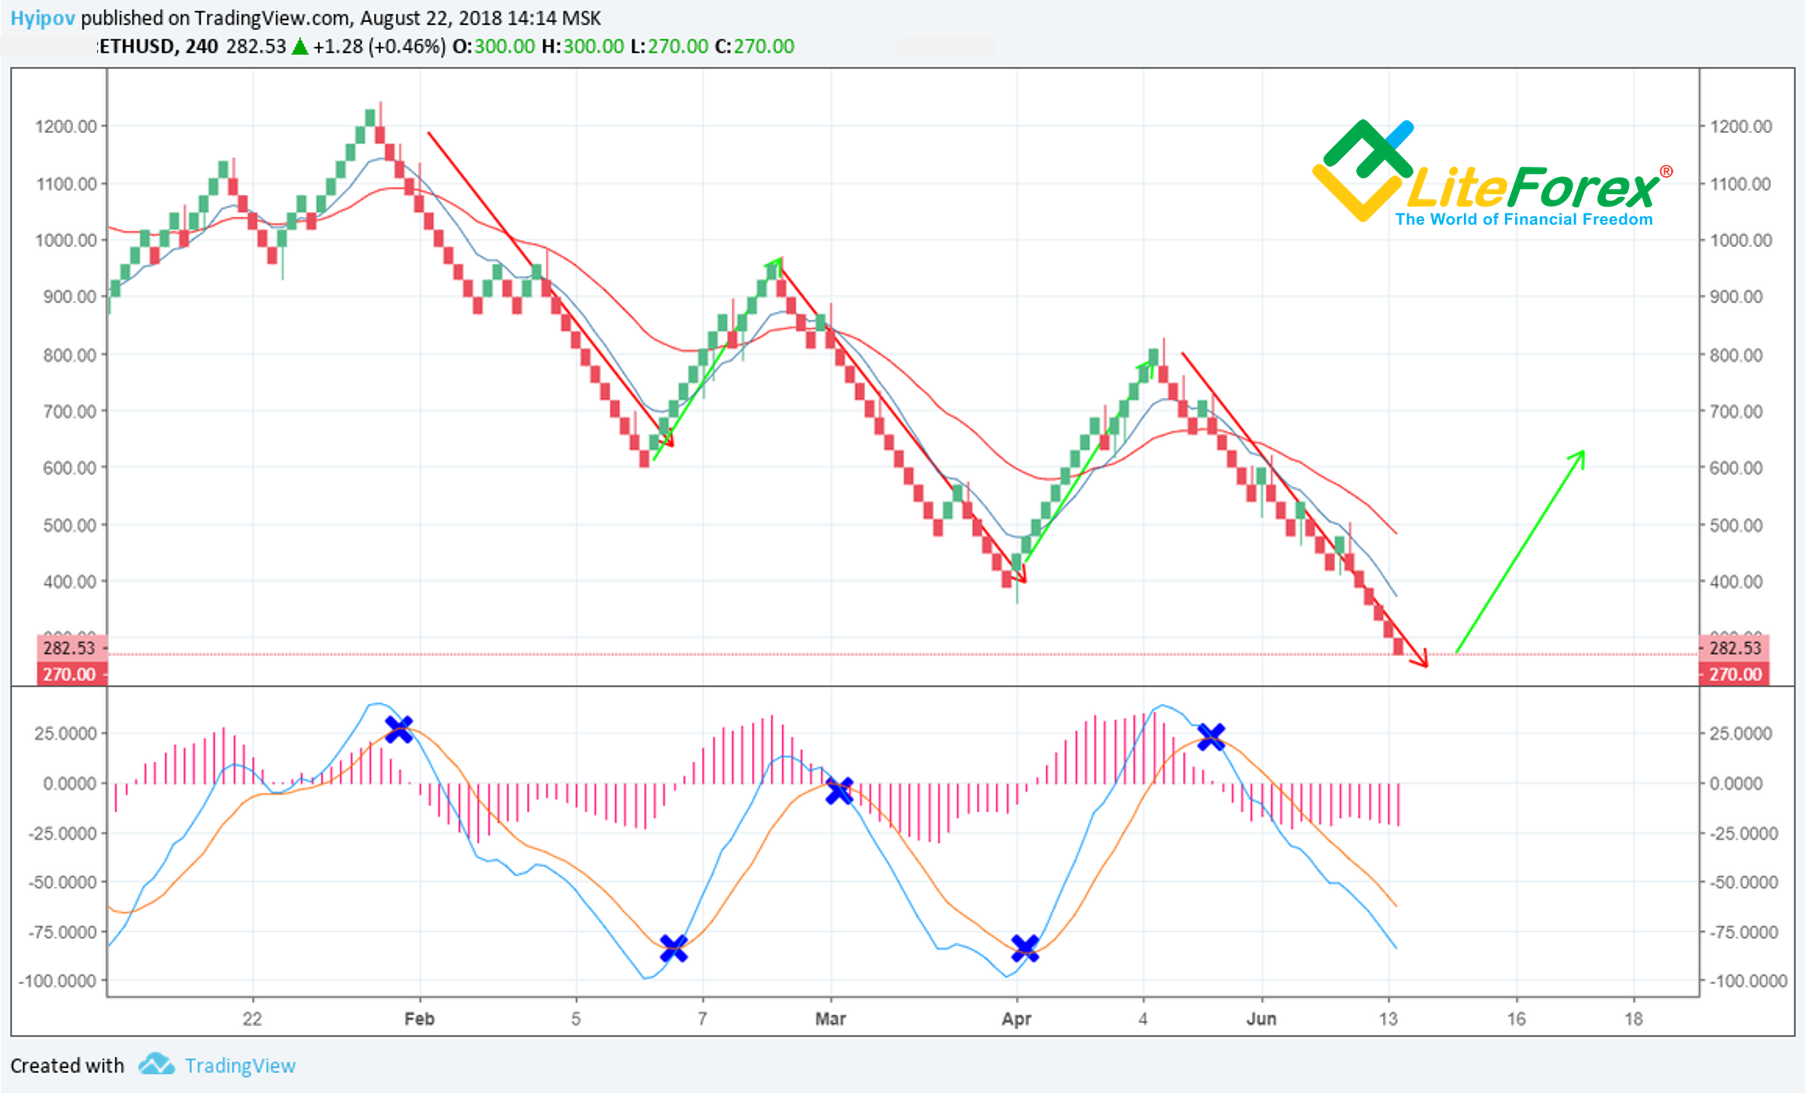
In the training article, I emphasized the importance of the appropriate box size in Renko charts.
Experimenting with Renko for ETH/USD, I surprisingly discovered one useful MACD function. It helps me figure out the most appropriate box size.
It is quite simple. You are changing the box size until MACD moving averages stop sending false signals and there are as few of them as possible.
For the ETH/USD ticker in the 4-hour timeframe, the most relevant box size is 30 USD.
Finally, there is an interesting wave formation, built of repeated cycles, where the waves of the growth and the correction have almost equal length.
Based on this cycle, Ethereum is close to the bearish wave finish and is likely to reverse with a target at around 600 USD.
However, to prove the future trend reversal, MACD must send the corresponding signals; it quite accurately, even though litter later, marked the beginning of a new wave.
Summary: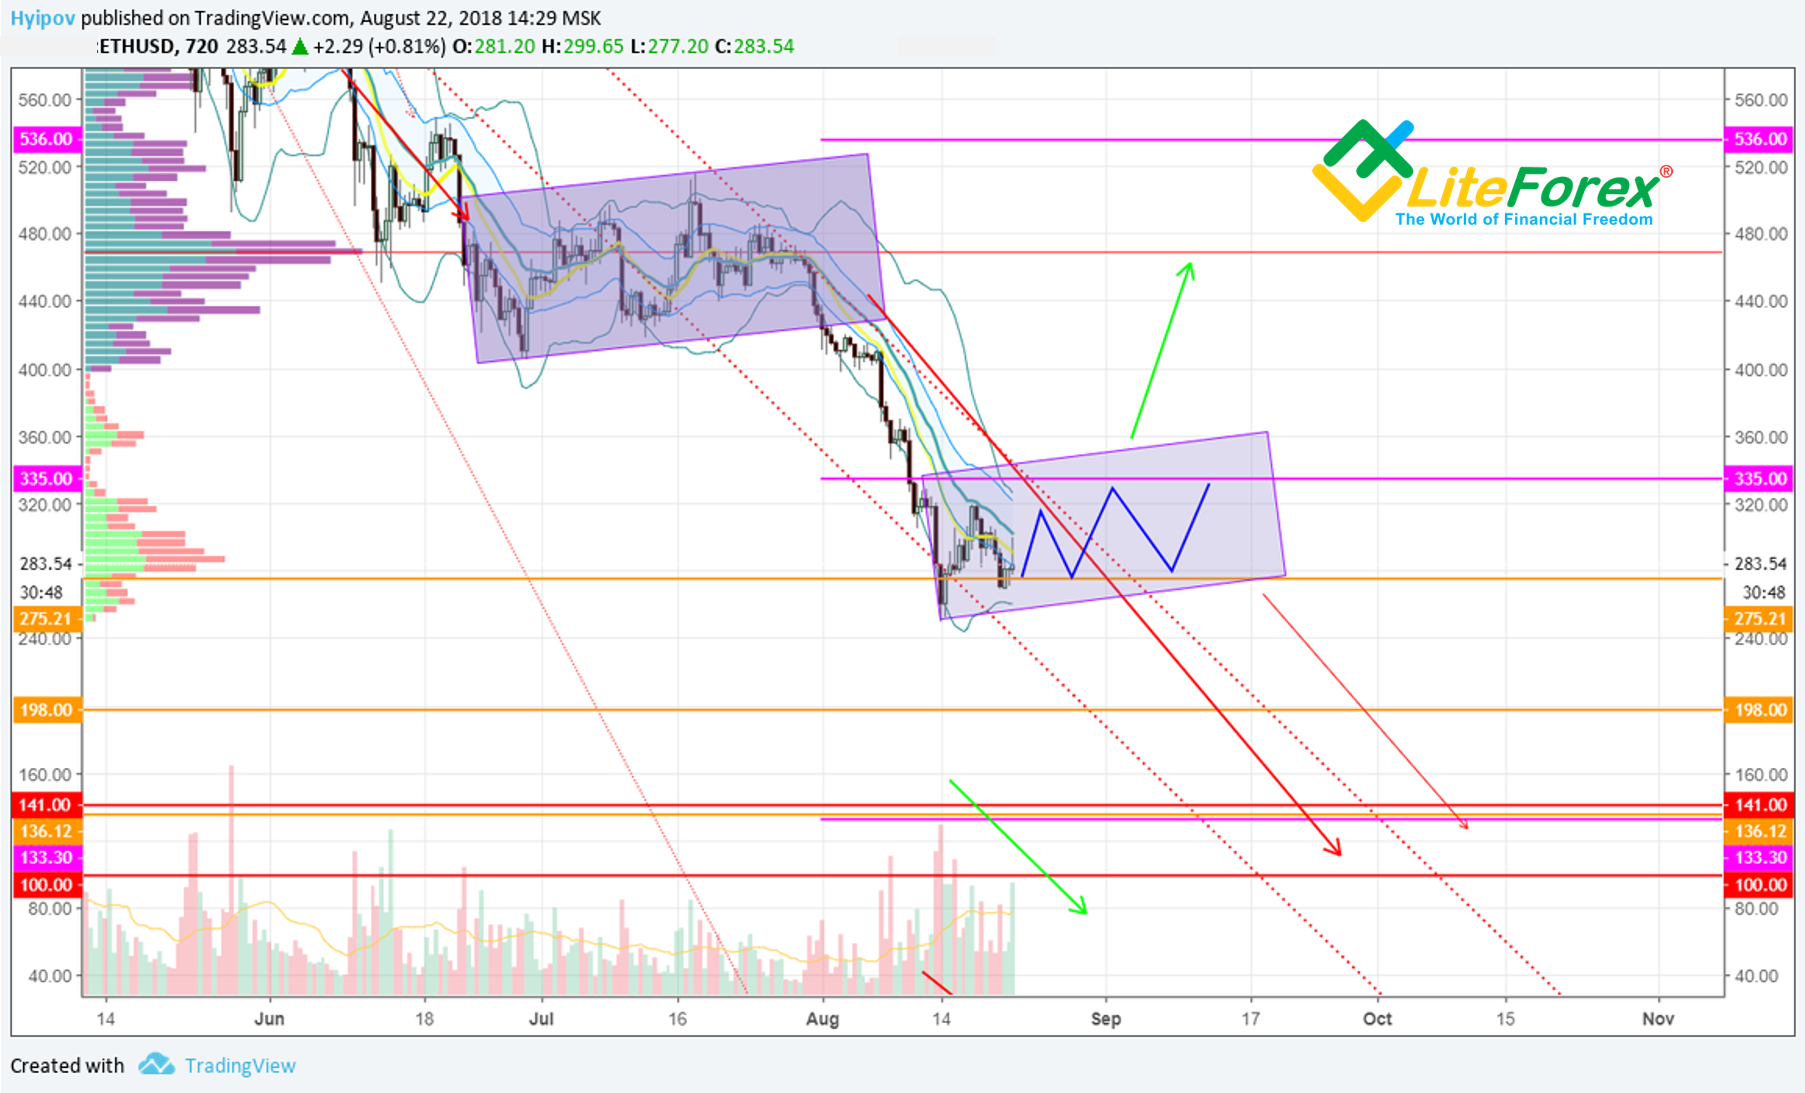
ETH/USD is performing worse than the market, but the bearish trend without any price rebounds puts an additional pressure on Ethereum bears; it is extremely difficult to draw the price lower without a rollback, which is proved by a decline in trading volume and lower volume of sell positions.
I think, the most likely Ethereum trading scenario suggests that the ticker should consolidate inside the channel between 250 USD and 360 USD during the coming week. The consolidation should provide clearer market sentiment, which will allow figuring out the next Ethereum price moves during the first days of September.