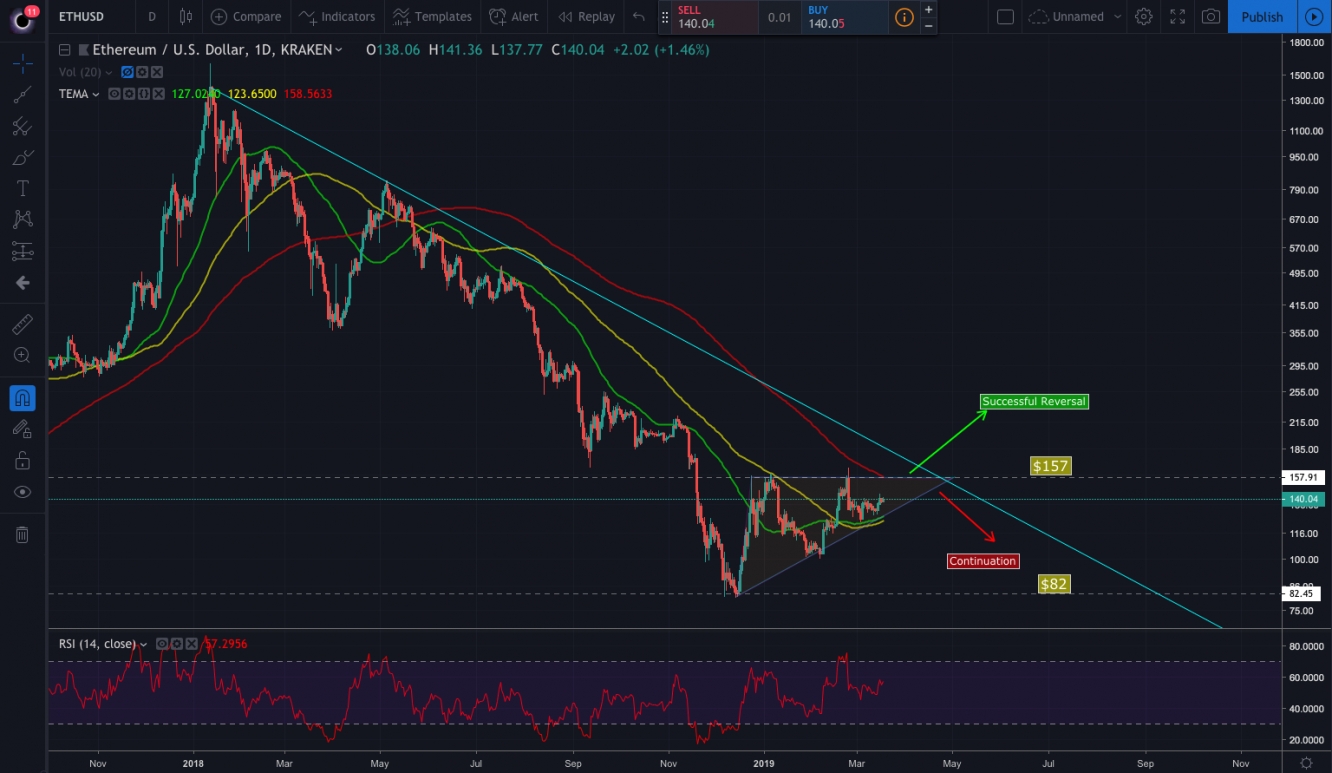
The number-two Cryptocurrency in market cap, Ethereum, is looking to reverse its downtrend, which started back in January 2018. ETH managed to reach close to $1,400, its highest price in history, before the start of the downtrend where it reached a bottom price of $80 in mid-December 2018. The 94% drop from $1,400 to $80 was not fun and ultimately, ICOs were dragged down as well since ETH was a popular choice for investors to fund their selected projects.
Technical Analysis in Cryptocurrency especially should be used as a supporting factor for making investing decisions. I consider TA as the physical manifestation of investors' sentiments printed as candles and patterns. Directions of breakouts highly depend on news and fundamental analysis. Even so, it is not always guaranteed. TA do tell an overall story in the general sentiments of investors and traders. On the chart, we see Ethereum reversing which means sentiments are shifting. Let's dive in deeper with the charts to 'predict' where Ethereum can move towards.
Ethereum Forming Ascending Triangle Reversal
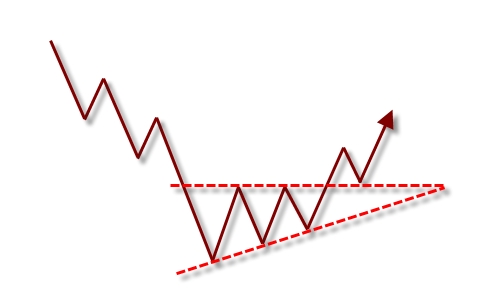
An ascending triangle is predominantly a bullish continuation pattern. It can also be found at the bottom of a downtrend as a reversal pattern. However, an ascending triangle reversal pattern does not guarantee a successful reversal. Cryptocurrencies depend on news and speculation more than technical analysis. Therefore, we should be on a lookout for news over the next month or two that will determine the direction of the breakout.
If Bullish Breakout?
$150-$160 seems to be a strong resistance point. But should Ethereum manage to break this price with volume (and positive news), the sky is the limit as it will usher the arrival of Crypto Spring.
If Bearish Continuation?
If Ethereum breaks below the ascending triangle, we should expect it to continue its downtrend with a visit back down to $82 looking very likely to happen. At $82, we need to hope the price holds to form a double bottom and offer bulls a platform to build a strong reversal argument.
The Moving Averages (50, 100, 200)
Green = 50MA
Yellow = 100MA
Red = 200MA
A positive sign we can take is the squeezing of these three moving averages. The squeezing of moving averages signifies a trend reversal is happening. Ethereum is finally doing so since July 2018. Prior to that, the downtrend was strong.
Both 50MA and 100MA looks to cross the 200MA which will lead to a Golden Cross. As long-term indicators carry more weight, the golden cross indicates a bull market on the horizon and is reinforced by high trading volumes.
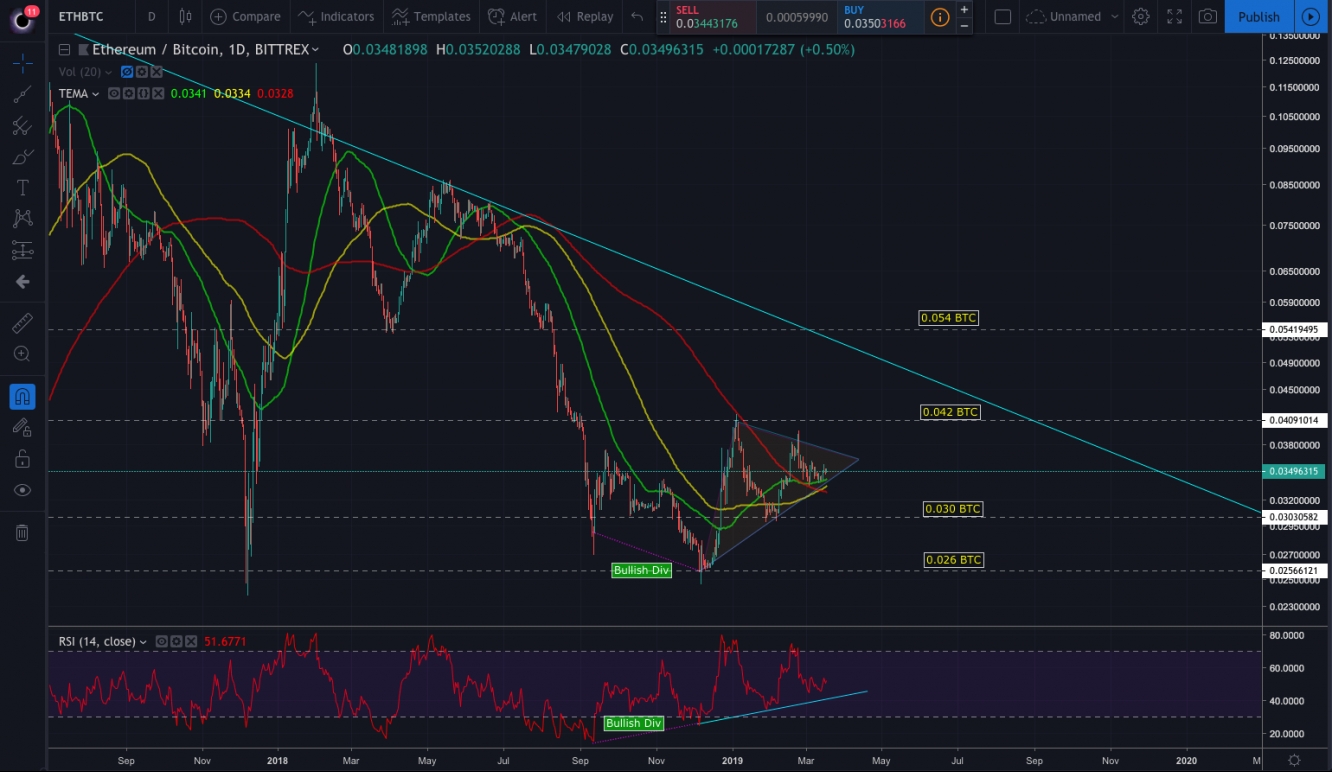
Ethereum against Bitcoin pairing seems a little confusing. So let us break it down.
The Moving Averages has already performed a golden cross which is a positive signal that ETH is turning bullish in BTC value. However, I am not yet convinced as the resistance point of the downtrend is still far ahead (cyan diagonal line). We can consider ETH in BTC value bullish only after it has broken this resistance line.
The Month Of April
Next month will be very interesting as Ethereum builds its foundation to the next bull run or prolonging Crypto winter. What do you think of ETH's movement in the next few months? Is there any particular news that can act as the determining factor in ETH's direction?
Disclaimer: The contents of this article are not intended as financial advice. Please do your own due diligence on any investment or trading decisions.


