- Cryptocurrencies surged after weak US data fueled hopes of a potential Fed rate cut in September.
- Investors eye tomorrow's nonfarm payrolls data for further confirmation, hoping for a soft number to fuel the rally.
- Amid this, Ethereum is at a crossroads now and could breakout higher depending on the news flow.
- Invest like the big funds for under $9/month with our AI-powered ProPicks stock selection tool. Learn more here>>
Cryptocurrencies kicked off the week with a positive swing, breaking free from the price band they were trapped in since late May. This partial recovery can be traced back to weak economic data from the US, sparking speculation that the Federal Reserve might start cutting rates in September.
The data revealed a slowdown in the labor market and the manufacturing sector. While the service sector remained strong, highlighting persistent inflationary pressures, the weak numbers suggest the Fed might be more cautious about raising rates.
Investors now keenly await tomorrow's nonfarm payrolls data, a key indicator that could further influence the Fed's decision later this month. A decline in employment numbers could significantly boost the upward momentum in the crypto market.
Adding to the bullish sentiment, Bitcoin, the dominant cryptocurrency, has seen increased institutional investment fueled by the introduction of spot ETFs (exchange-traded funds). This surge in Bitcoin demand positively impacts altcoins as well.
Ethereum, a major altcoin with the power to influence the entire market, holds its own narrative alongside this broader market movement. Crypto traders are eagerly awaiting news on the launch of Ethereum spot ETFs, which could trigger significant new investment and potentially lead to more volatile trading for Ethereum in the near future.
Weak news flow on this front this week has dampened enthusiasm, but any positive developments on Ethereum ETFs in the coming days could dramatically impact the cryptocurrency's price. This combination of factors - weak economic data, potential delays in rate hikes, and the anticipation of Ethereum spot ETFs - paints a picture of a crypto market poised for continued growth and potentially increased volatility.
Technical View: Ethereum Poised for Breakout?
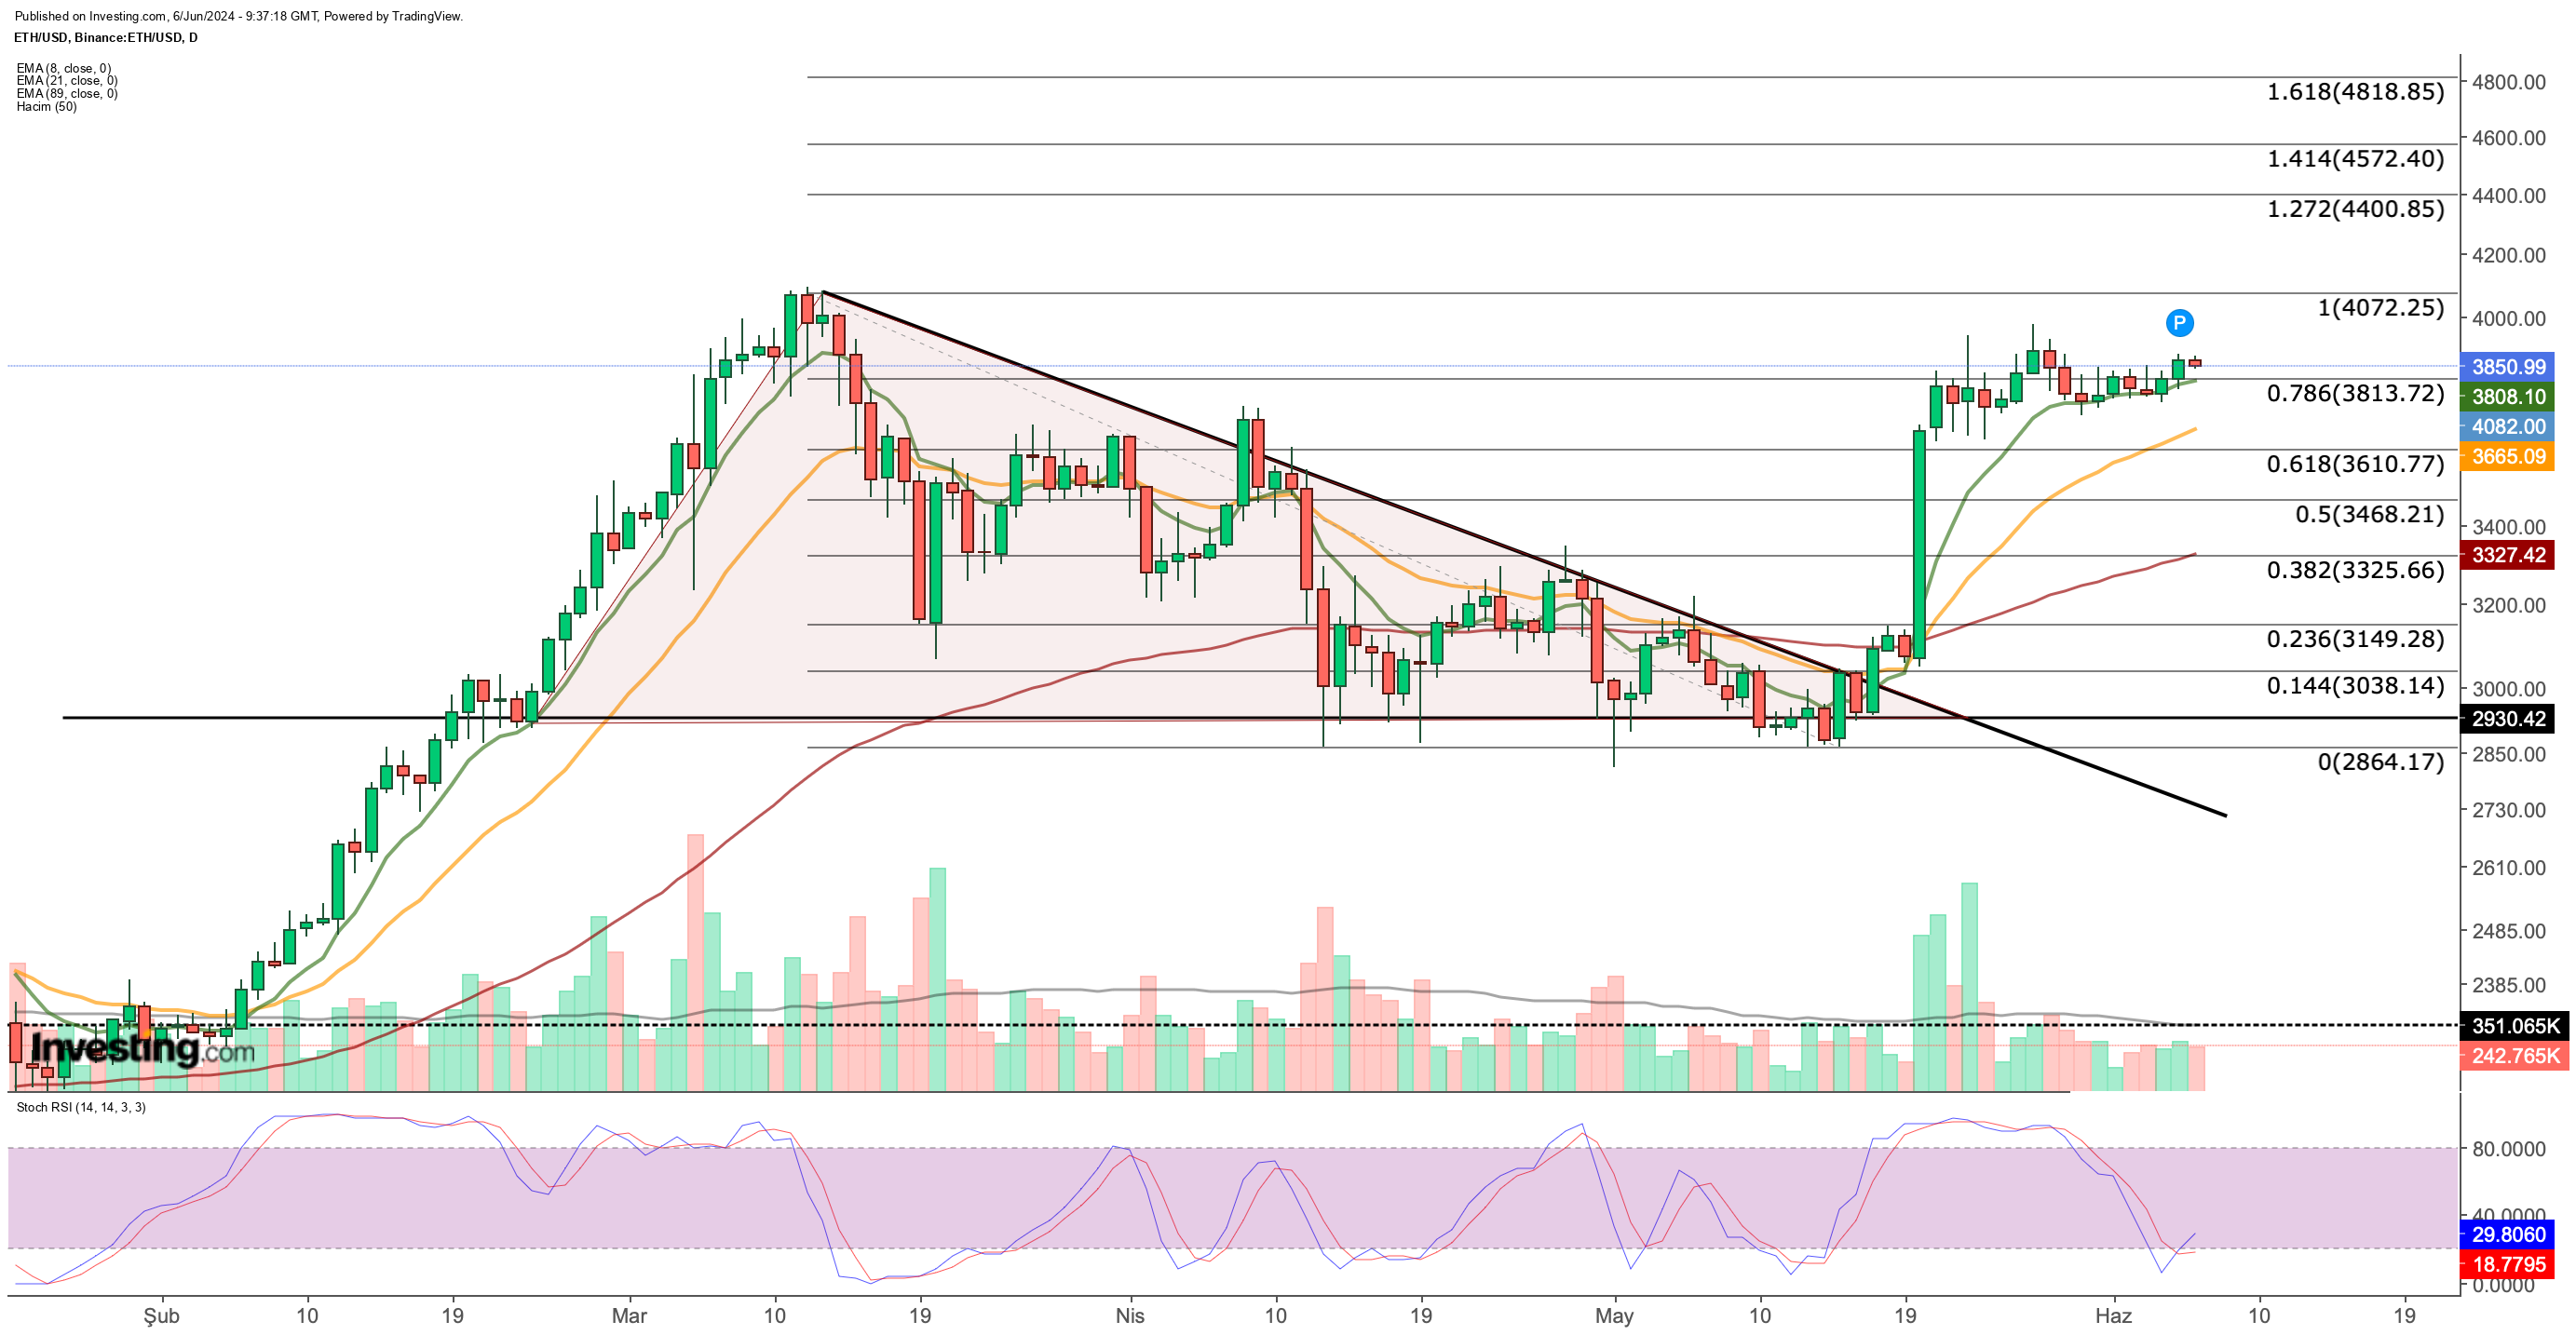
Ethereum (ETH) is currently facing a critical resistance zone around $3,835, evident on the daily chart. This level has held strong throughout June, with price action oscillating between this resistance and the 8-day EMA.
However, a bullish signal emerges from the Stochastic RSI indicator. After dipping into oversold territory during the recent consolidation, the Stoch RSI has now begun to rise. This suggests a potential bounce for ETH, especially if it manages a clear weekly close above the $3,835 resistance zone.

In May, a similar oversold reading on the Stoch RSI preceded a significant ETH price increase. This surge coincided with the news of the SEC's first approval for a spot Bitcoin ETF.
Positive news flow could be the key catalyst for ETH to break through the current resistance and reach the next hurdle near $4,100. A return of buying volume at this level would further strengthen the upward momentum.
Looking beyond the immediate resistance, a potential bullish setup could unfold if ETH establishes support around $4,100. This could pave the way for a move towards the Fibonacci expansion levels, potentially pushing ETH into the $4,400 - $4,800 zone.
On the downside, $3,800 remains a critical support level. A drop below this level due to market volatility could send ETH down to $3,610. Breaching this floor could invalidate the bullish setup and trigger a downward move toward $3,300, potentially fueled by negative news events.
Overall, Ethereum is at a crossroads. A breakout above $3,835, coupled with positive news and increased buying pressure, could propel ETH towards higher levels. However, a breakdown below $3,800 and negative news flow could lead to a significant decline.
***
Take your investing game to the next level in 2024 with ProPicks
Institutions and billionaire investors worldwide are already well ahead of the game when it comes to AI-powered investing, extensively using, customizing, and developing it to bulk up their returns and minimize losses.
Now, InvestingPro users can do just the same from the comfort of their own homes with our new flagship AI-powered stock-picking tool: ProPicks.
With our six strategies, including the flagship "Tech Titans," which outperformed the market by a lofty 1,745% over the last decade, investors have the best selection of stocks in the market at the tip of their fingers every month.
Subscribe here and never miss a bull market again!

Don't forget your free gift! Use coupon codes OAPRO1 and OAPRO2 at checkout to claim an extra 10% off on the Pro yearly and bi-yearly plans.
Disclaimer: This article is written for informational purposes only; it does not constitute a solicitation, offer, advice, or recommendation to invest as such it is not intended to incentivize the purchase of assets in any way. I would like to remind you that any type of asset, is evaluated from multiple points of view and is highly risky and therefore, any investment decision and the associated risk remains with the investor.
