Ethereum trading against a powerful confluence zone. Tremendous energy builds up before the explosive move.
Ethereum’s Gann Square of 144

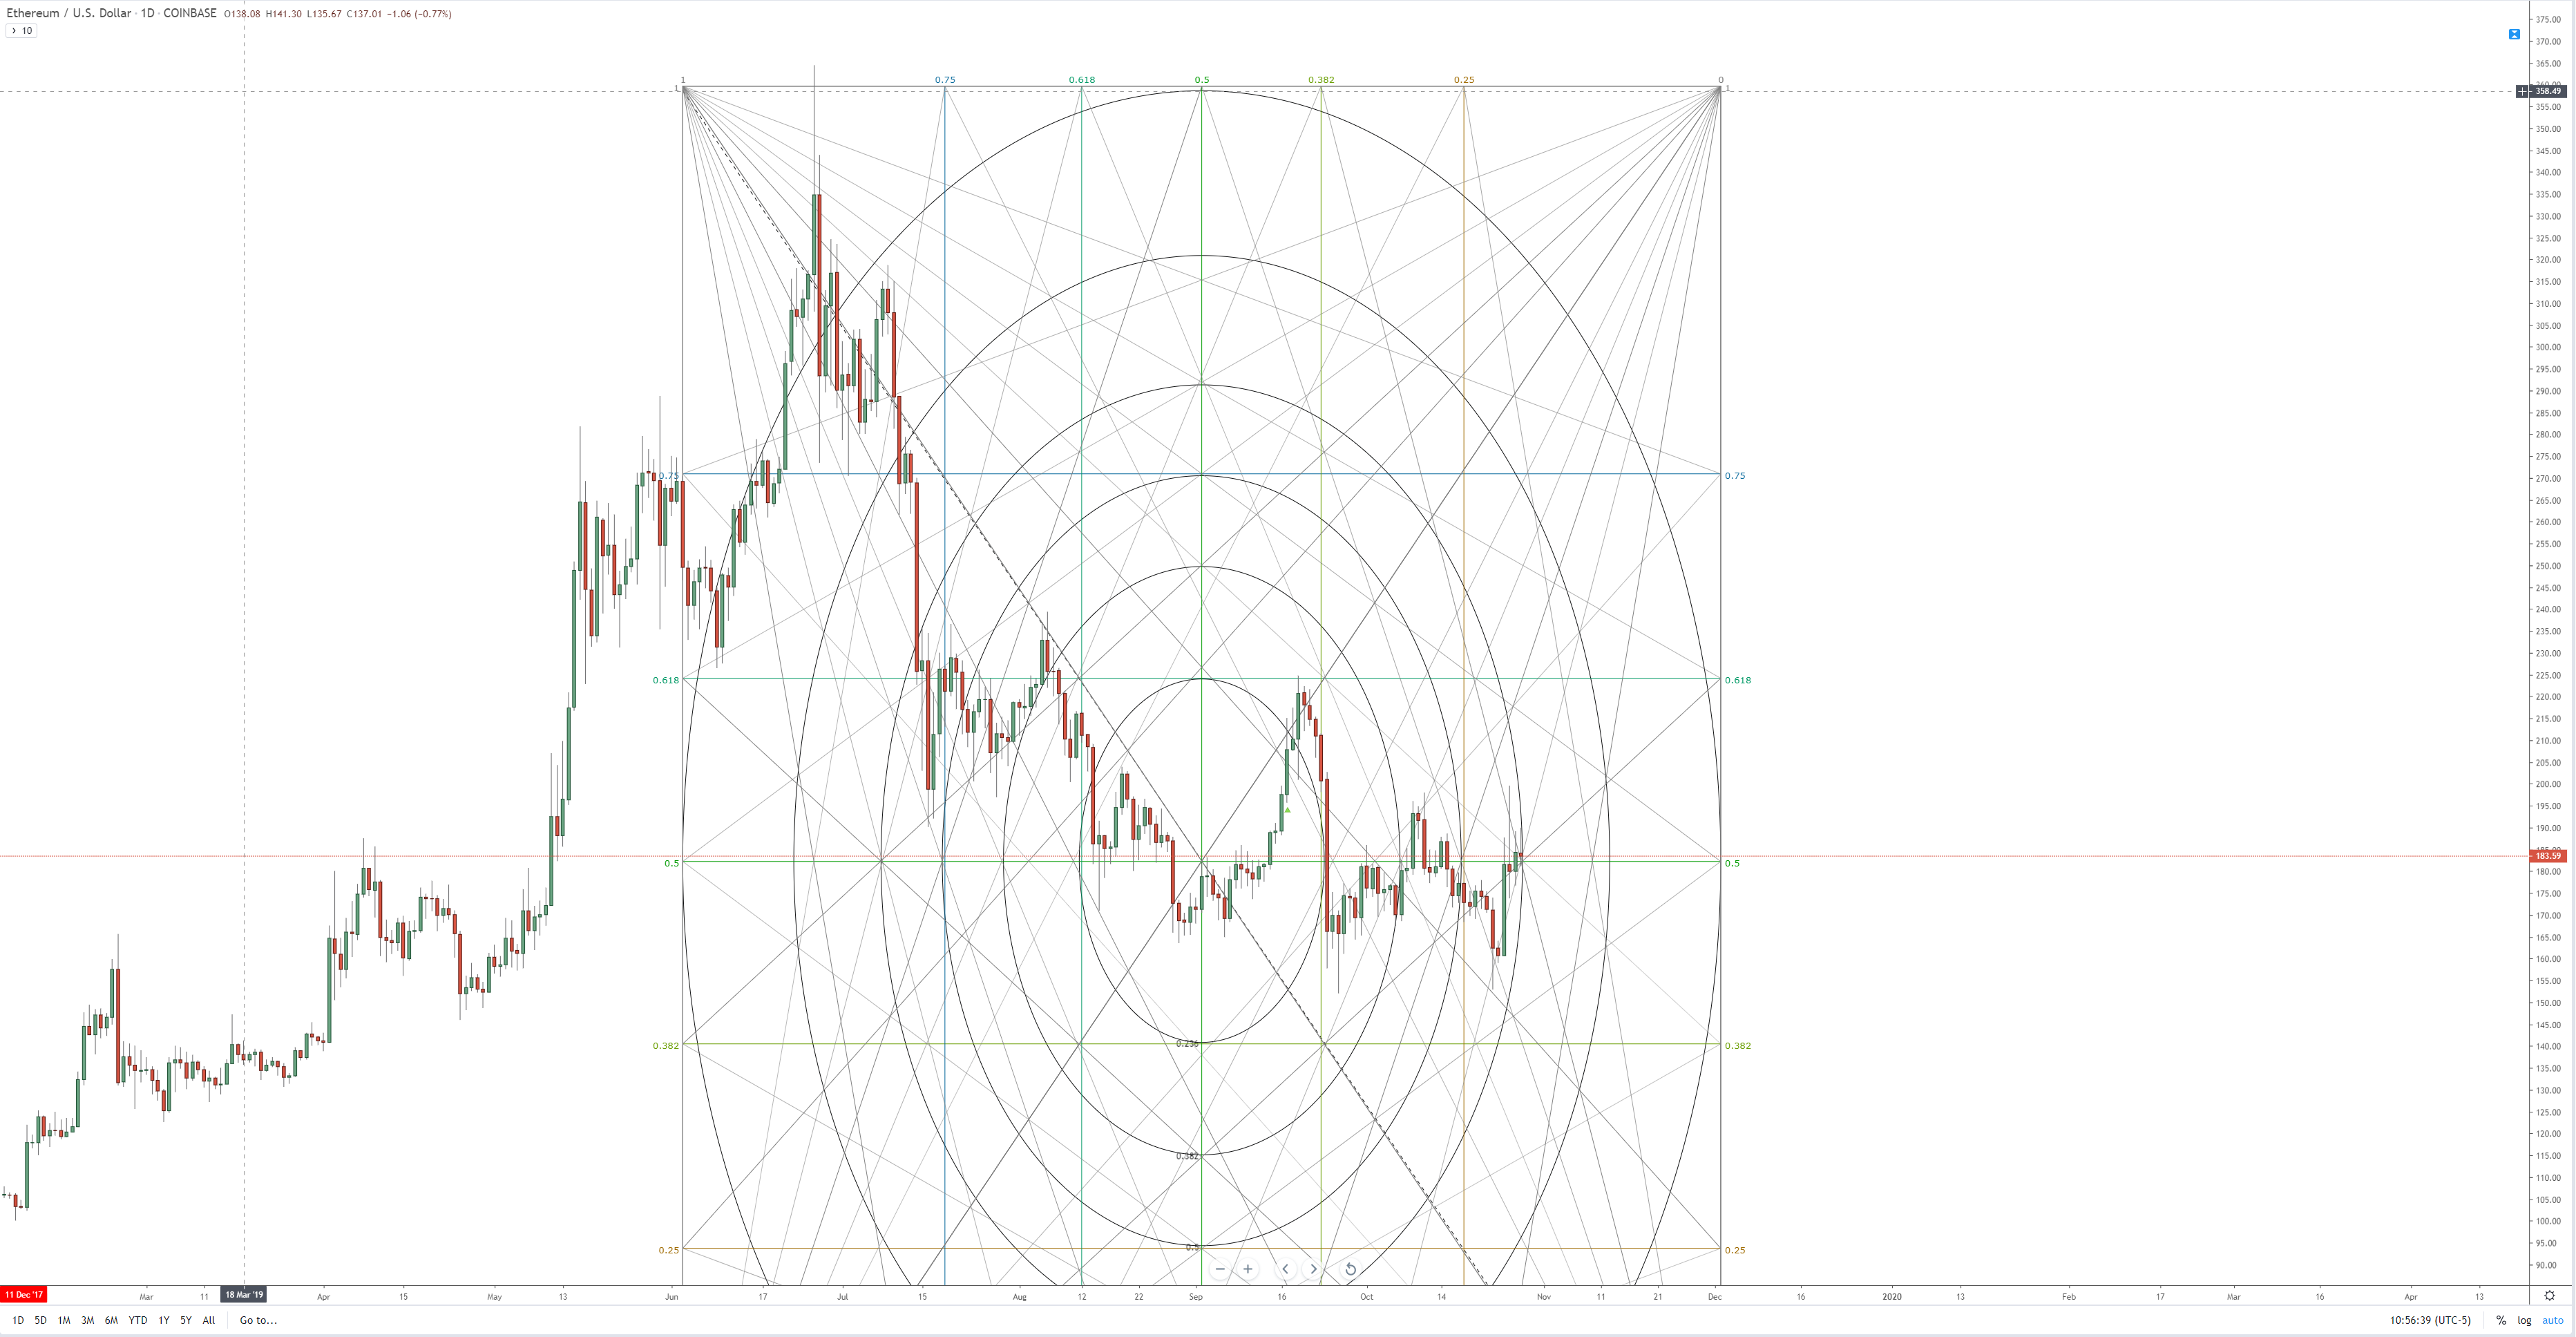
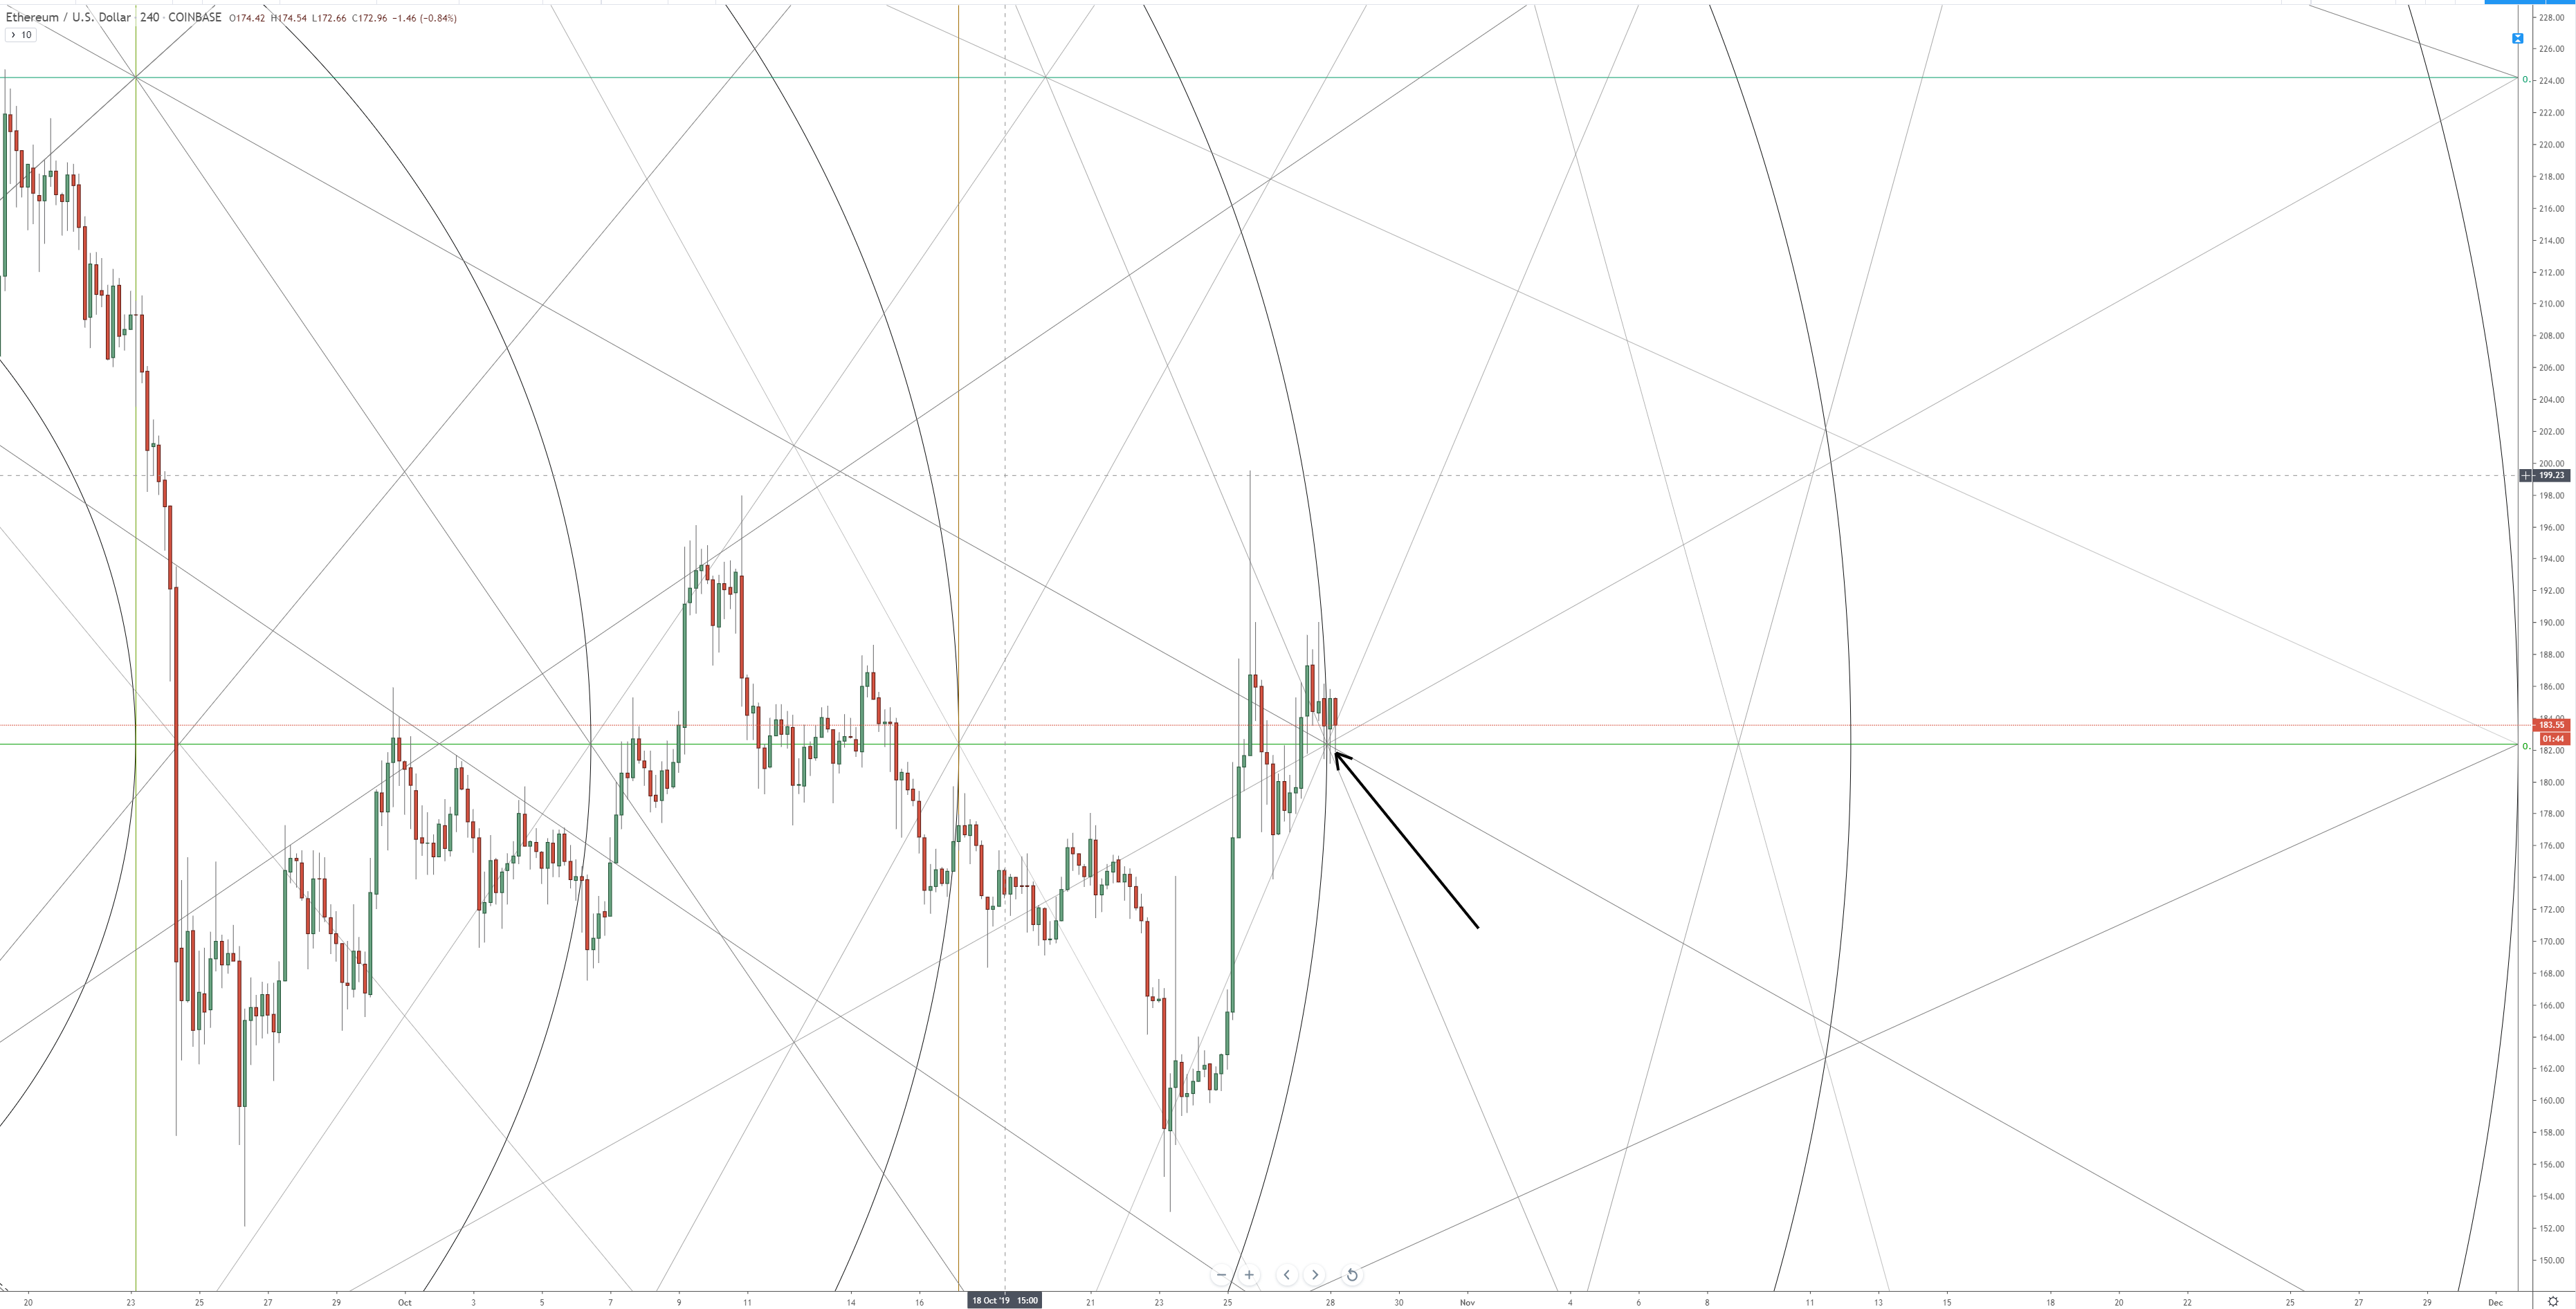
The chart above shows a 1/4th view of Ethereum’s Square of 144. Gann’s Square of 52. The Square of 52 can be drawn for 52 days, 52 hours, 52 months, 52 years, etc. It most often applied on a weekly chart – this makes sense with 52 weeks in a year. The Square is developed from some significant high or low in the past 52 weeks. The geometry of this particular form of analysis creates robust and predictable confluence zones – one of which Ethereum is currently trading against. The image below is a ‘zoomed’ in look on the 4-hour chart.

The black arrow is pointing at a massive congestion zone. There are four angles in the Square of 52 that converge on top of two other levels: the 50% price range of the Square of 52 and the 50% Fibonacci range of a Fibonacci arc. When we get such a massive collection of critical geometric positions that converge on a single zone, these almost always create extremely fast moves higher or lower. When price moved in time beyond the 50% level of the Fibonacci arc, that sets off a sort of timer or clock. The question then becomes, “Which direction?” This is where interpretation comes in. The first thing I do is establish where the primary price support/resistance levels are.
I can already negate 3 of the four angles to determine price direction. The steepest of the angles should be ignored because their levels are to fast and do not match the consolidation that Ethereum has been experiencing. The angle of most importance then is the one that goes from the far left-hand corner to the top right-hand corner. That is what I would consider being the primary trending angle. This angle is the most important because it is going to establish the price range channels that Ethereum will be trading in. It Ethereum can remain above that angle, then the range is between $184 and $218 for the next 30 days. If it breaks down and decides to trade lower than the channel range will be between $184 and $155. This is ultimately contingent on whether Ethereum will stay above or below the 50% price range of this Square of 52: $182.44.
The first chart in this article shows how steep all of these angles are, and we should recognize that the slope of these angles represents extreme historical volatility. We could undoubtedly observe Ethereum trade in some constricted ranges over the next couple of trading days, but we shouldn’t see much further tight trading after October 31st. Every day that we move closer to the end of this current Square of 52 means Ethereum gets into more and more open space in the Square of 52. We should expect to see some significant swings in November – swings that could quickly move +15-20% higher and +15-20% lower over just a few trading days. This current Square of 52 is hinting at some extremely volatile price action through November and into December.