Ethereum's Collapse Carries An Elliott Wave Message

Published 09/07/2020, 05:25 AM
Updated 07/09/2023, 06:31 AM

Ethereum, still the second-largest cryptocurrency with a market cap of ~$39B, was enjoying a strong 2020. ETH/USD was up 282% YTD until the start of September. The last few days, however, seem to have brought the bulls’ winning streak to its end.

The price of Ethereum collapsed from as high as $489 to less than $310, erasing over 36% of market value in just a week. As of this writing, ETH/USD is changing hands at roughly $350. The only question is: is this a buying opportunity or the start of a larger selloff?
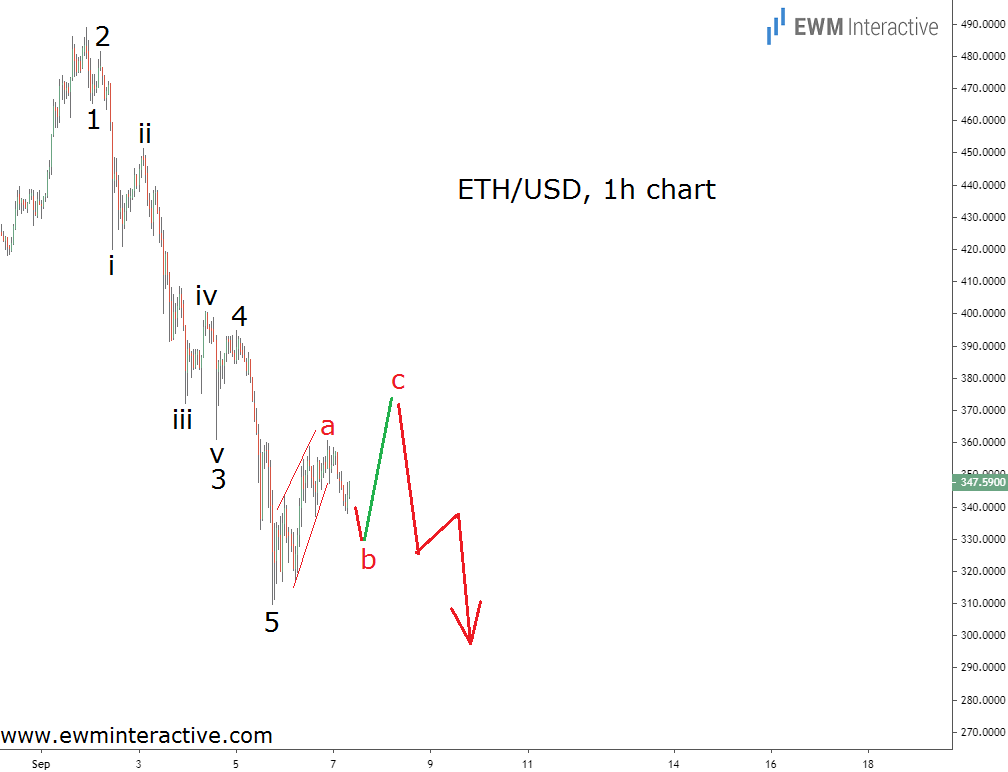
ETH/USD 1 Hr Chart

To find out, we decided to take a look at the recent plunge through the prism of Elliott Wave analysis. The hourly chart above reveals it can be seen as a five-wave impulse pattern, labeled 1-2-3-4-5. The five sub-waves of wave 3 are also visible and marked i-ii-iii-iv-v.

According to the theory, impulses show the direction of the larger trend. In other words, once the current corrective recovery ended, traders should expect more weakness to follow. The exact depth of the a-b-c retracement is unknown, but targets below $310 lie ahead when Ethereum bears eventually return. If this count is correct, the rest of 2020 is going to be nothing like its first eight months.

Original Post

Latest comments

Loading next article…
Risk Disclosure: Trading in financial instruments and/or cryptocurrencies involves high risks including the risk of losing some, or all, of your investment amount, and may not be suitable for all investors. Prices of cryptocurrencies are extremely volatile and may be affected by external factors such as financial, regulatory or political events. Trading on margin increases the financial risks.
Before deciding to trade in financial instrument or cryptocurrencies you should be fully informed of the risks and costs associated with trading the financial markets, carefully consider your investment objectives, level of experience, and risk appetite, and seek professional advice where needed.
Fusion Media would like to remind you that the data contained in this website is not necessarily real-time nor accurate. The data and prices on the website are not necessarily provided by any market or exchange, but may be provided by market makers, and so prices may not be accurate and may differ from the actual price at any given market, meaning prices are indicative and not appropriate for trading purposes. Fusion Media and any provider of the data contained in this website will not accept liability for any loss or damage as a result of your trading, or your reliance on the information contained within this website.
It is prohibited to use, store, reproduce, display, modify, transmit or distribute the data contained in this website without the explicit prior written permission of Fusion Media and/or the data provider. All intellectual property rights are reserved by the providers and/or the exchange providing the data contained in this website.
Fusion Media may be compensated by the advertisers that appear on the website, based on your interaction with the advertisements or advertisers.
© 2007-2025 - Fusion Media Limited. All Rights Reserved.