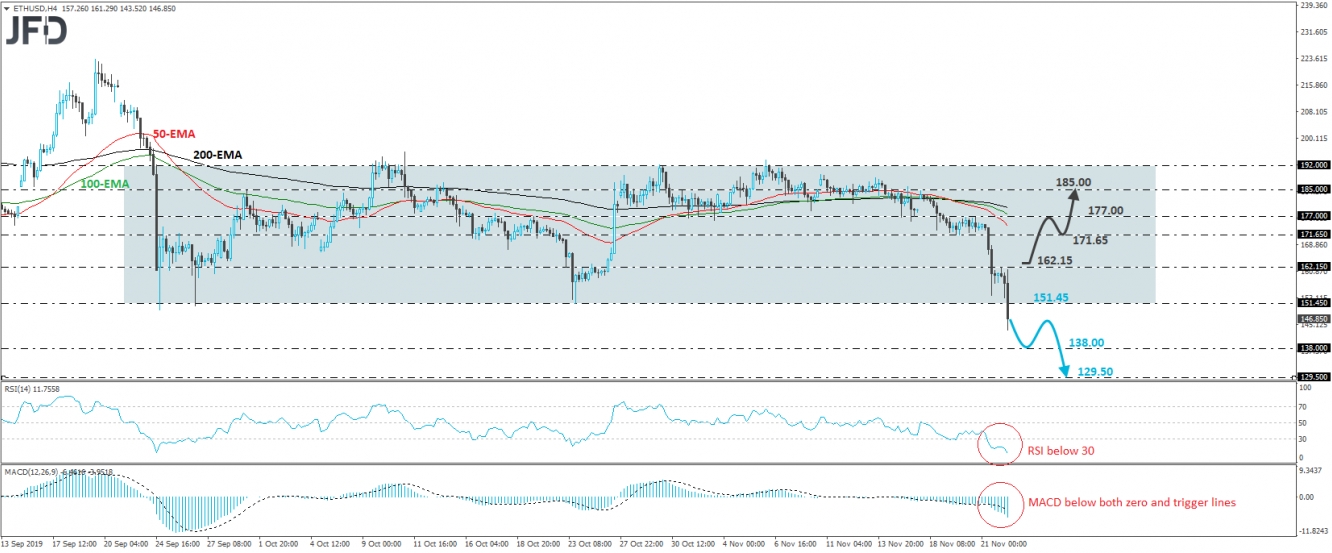
ETH/USD tumbled on Friday after it hit resistance at 162.15. The slide brought the price below 151.45, which acted as the lower end of a sideways range that’s been in place since September 24th. So, having in mind the downside exit out of that sideways path, we will adopt a bearish stance for now.
If the bears are willing to stay in the driver’s seat, then we may see extensions towards the low of May 1st, at around 138.00. The crypto could stop around there, or even rebound somewhat, but as long as it stays below the 151.45 zone, we would see decent chances for the bears to recharge and target the 138.00 zone again. If they are not willing to stop there this time around, a break lower may allow declines towards the 129.50 territory, which is the low of March 25th.
Looking at our short-term oscillators, the RSI stands below 30 and points down, while the MACD lies below both its zero and trigger lines, pointing south as well. Both indicators detect strong downside speed and corroborate our view for some further near-term declines.
On the upside, a break back above 162.15 may confirm the crypto’s return within the pre-discussed range and may pave the way towards the 171.65 barrier, marked by the inside swing low of November 19th, or the 177.00 zone, defined by the high of November 20th. Another break, above 177.00 may extend the recovery towards the high of November 17th, at around 185.00.

