
Ethereum (ETH) and Ethereum Classic (ETC) recently have both increased significantly and broken out of their respective trading patterns.
Will the gains keep coming or can we expect a reversal to bring ETH and ETC back down? Do either have profitable trade set-ups?
In this article, we will try to answer these questions by comparing price trends and fluctuations alongside technical indicators. To conclude, we summarize our findings and rank both of the cryptocurrencies based on their future price potential.
Ethereum (ETH) vs Ethereum Classic (ETC): Price Outlook
ETH/USD reached a low of $119.22 on Feb 12. Over the next few weeks, Ethereum made significant gains, reaching a high of $170 on Feb 24.
Since then, Ethereum has been trading inside an ascending channel as seen in the graph below:
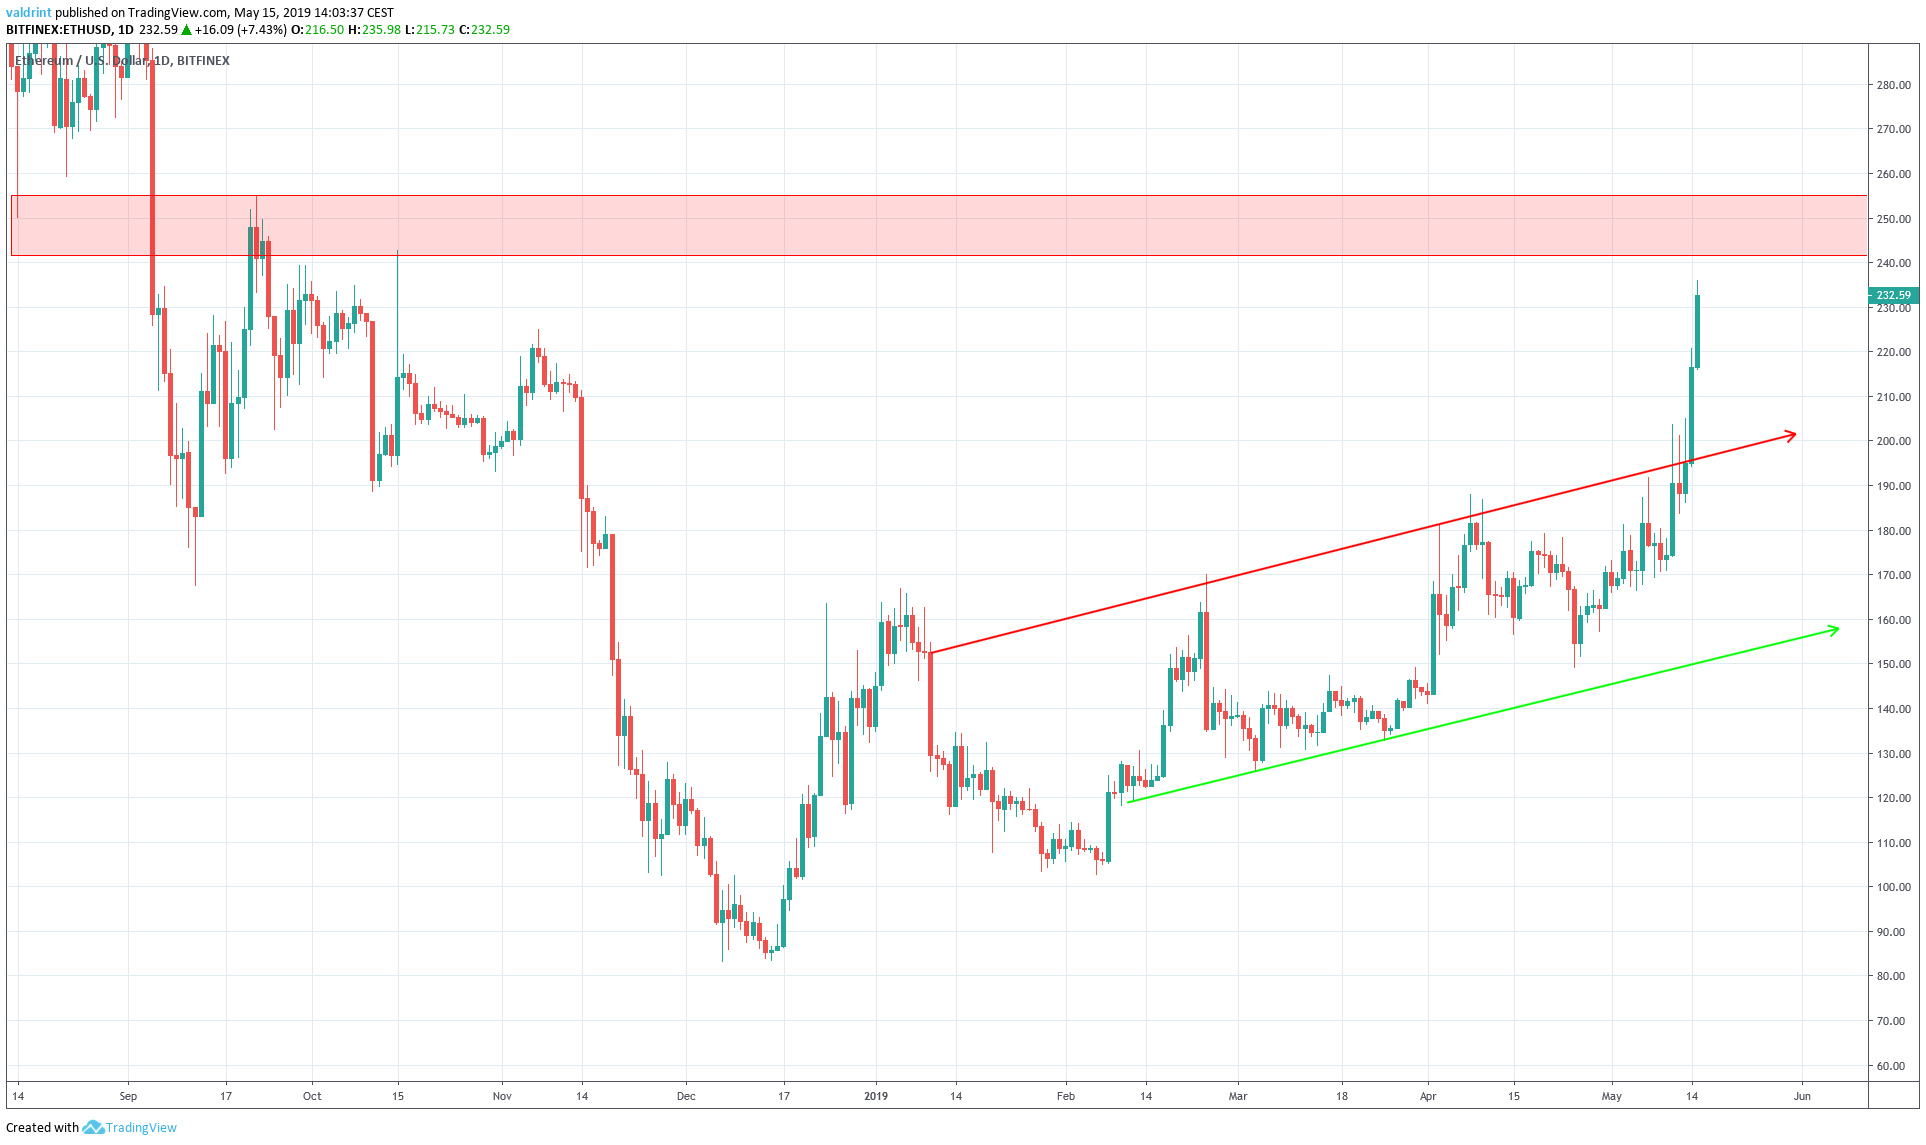
Price broke out from the resistance line of the channel on May 13.
At the time of writing, it had reached highs of $235.98. Since the breakout, the price has not been following an apparent trading pattern.
There is major resistance near $250.
Ethereum Classic has also been trading along an ascending support line since reaching highs above $8 on Apr 7. It has been on a gradual decrease since.
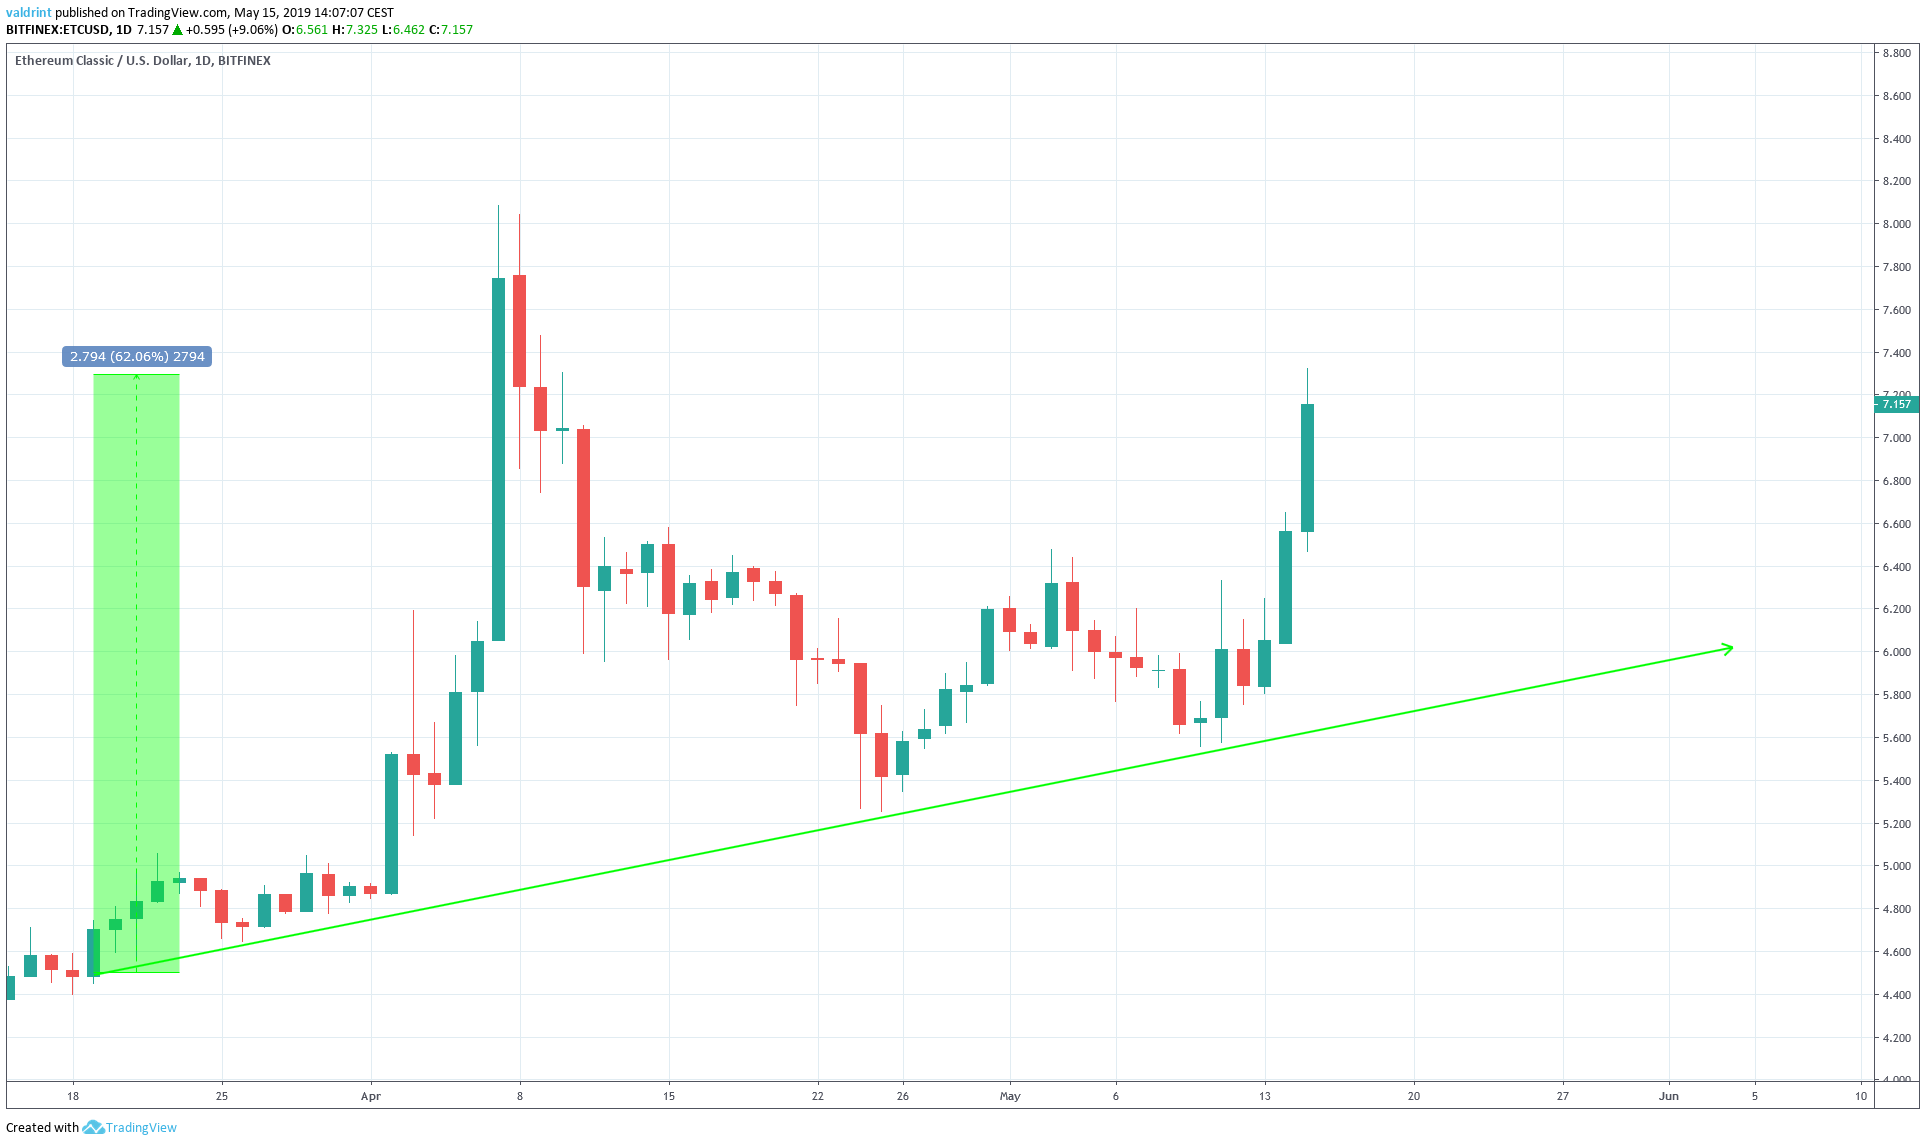
Since the beginning of the support line, the price has increased by 62%. However, there is no visible resistance line or apparent trading pattern.
Let’s analyze ETH closely and try to see if a trade setup can be put in place.
Ethereum’s Ascending Channel
To better assess possible price fluctuations, Ethereum is analyzed alongside volume and the RSI below:
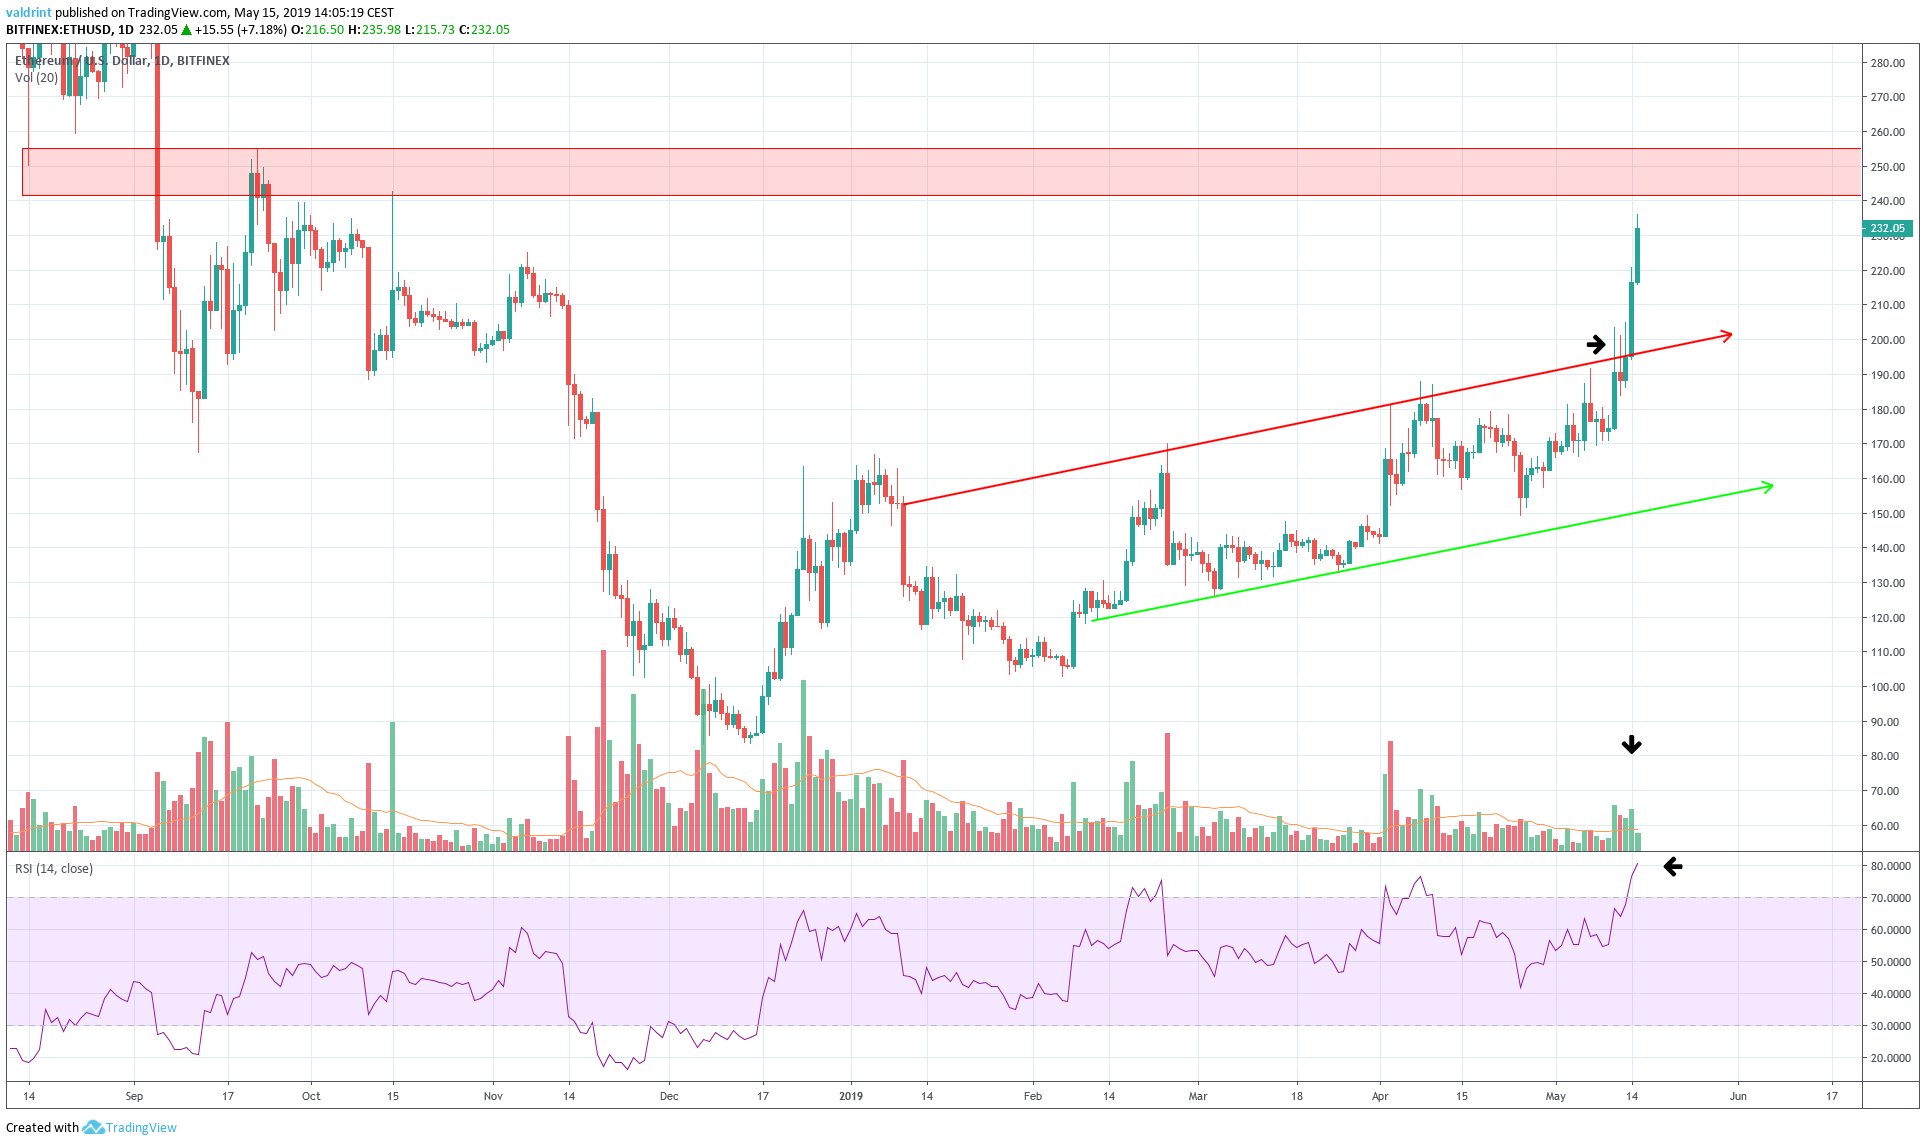
On May 12, the price broke out from the ascending channel it had been trading in.
The breakout occurred on average volume. This may indicate that the movement does not have a lot of strength. A reversal might be in store.
Furthermore, the RSI is deep into overbought territory. However, no divergence has developed yet.
There is a significant resistance area near $250. These indicators suggest that Ethereum will likely not move above this area.
Due to the fact that the price is not following a trading structure, no trade setup is available.
If the price reaches our resistance area, we will analyze a possible short trade.
Ethereum Classic’s Ascending Channel
To better assess possible price fluctuations, Ethereum classic is analyzed at two-hour intervals from Apr 7 to May 15 alongside volume and the RSI:
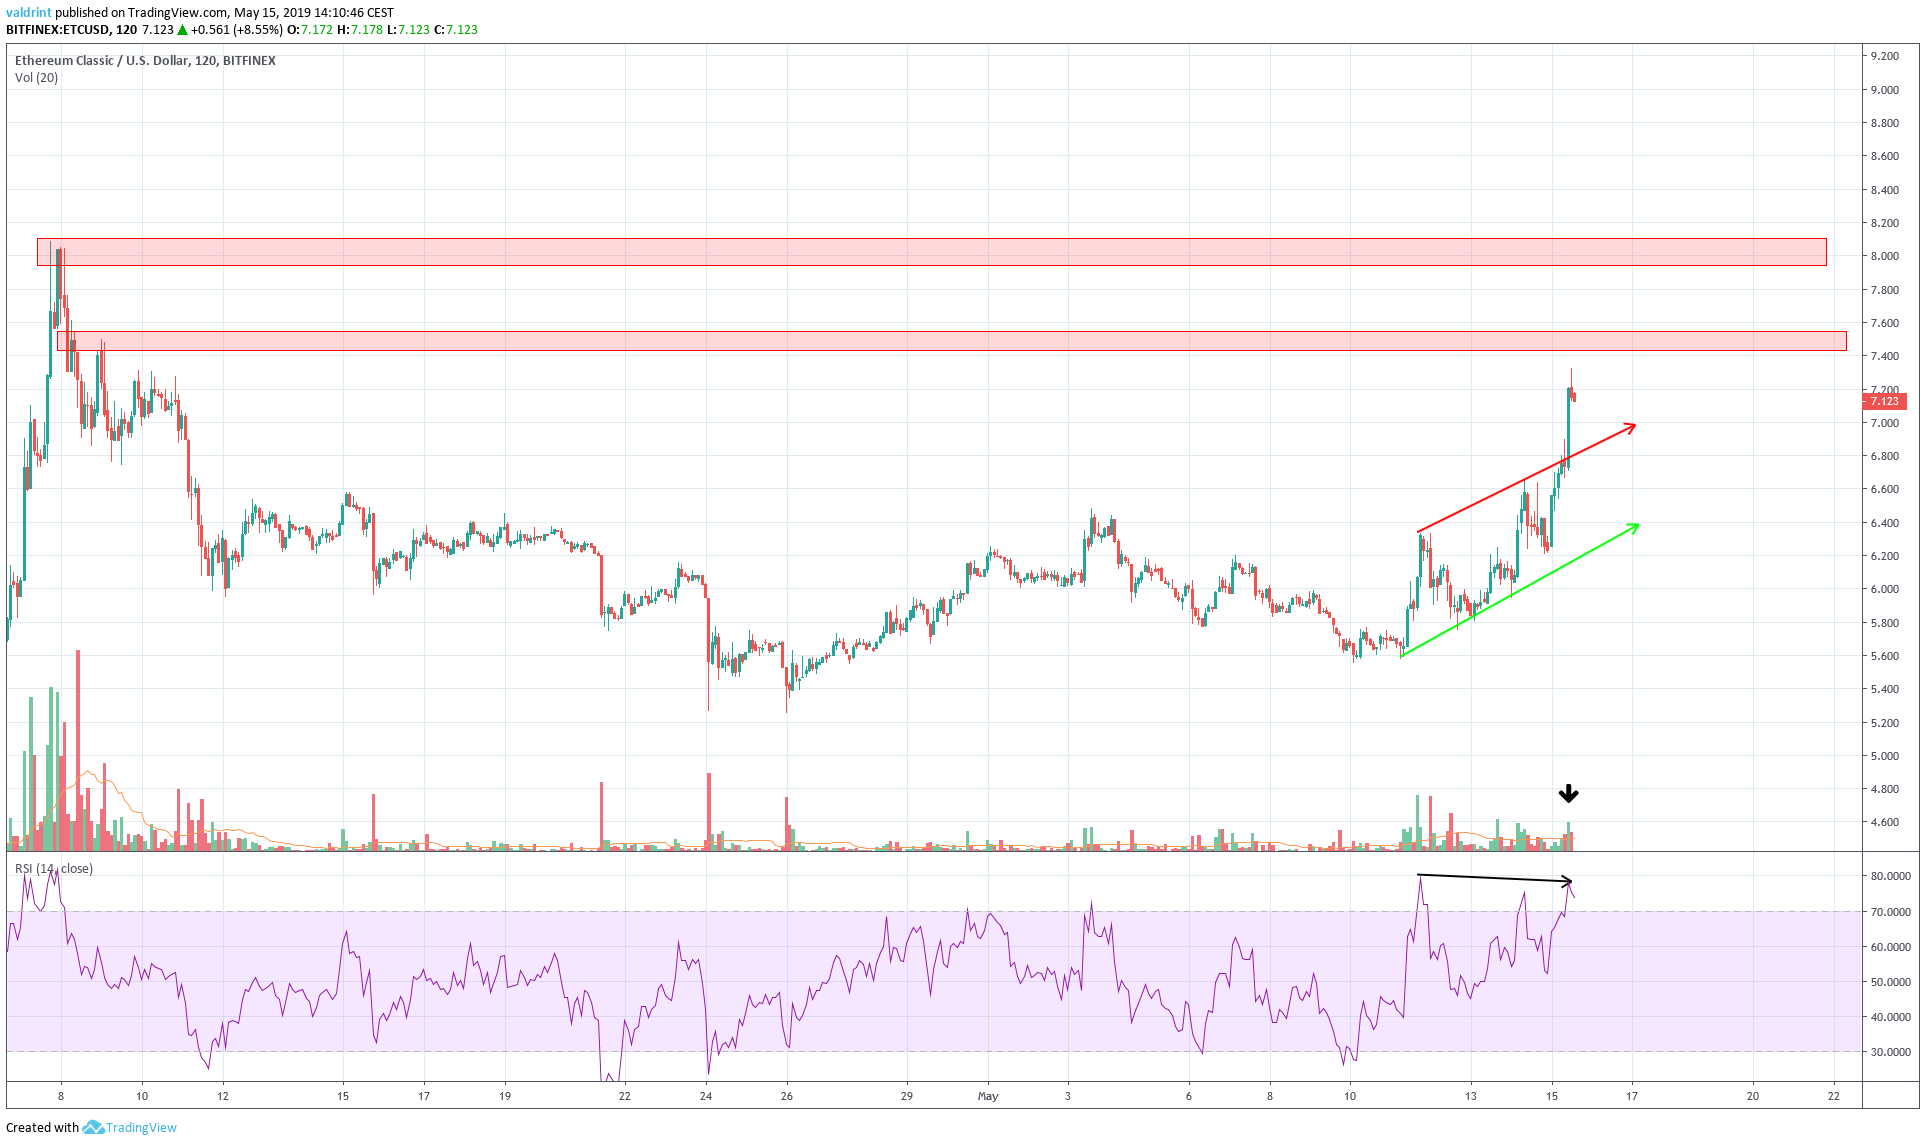
On May 11, the price reached a high of $6.33. It continued to increase and reached a higher high of $7.32 on May 15. This movement caused it to break out from a short-term ascending triangle.
The breakout occurred on average volume.
Furthermore, the RSI reached the first high on May 11. However, it has continued to generate lower values since.
This is known as bearish divergence and often precedes price decreases.
The use of these indicators makes it unlikely that the price will move above the resistance at $7.5 and $8.
If the price reaches these areas, we will analyze a possible short trade setup. Until it does, however, we do not see any profitable trade setups.
Conclusion
To conclude, ETH recently broke out from an ascending channel, while ETC is following an ascending support line.
In the case of ETH, the breakout occurred with slightly above average volume. The RSI is also in overbought territory.
Similarly, ETC also broke out from a short-term ascending channel. The breakout occurred on average volume. Furthermore, the RSI has moved into overbought territory and has developed bearish divergence.
Due to the recent breakouts from their respective patterns, no profitable trade setups were identified for either.
If the price of ETH and ETC reaches their respective resistance areas, possible short trade setups will be analyzed.
To conclude, we believe that ETH faces better short-term prospects than ETC at the current moment, due to the fact that it is further away from its resistance area.

Disclaimer: This article is not trading advice and should not be construed as such. Always consult a trained financial professional before investing in cryptocurrencies, as the market is particularly volatile.