Analysis for Ethereum to Bitcoin. Updated Ethereum scenario, key levels and general market sentiment. In this post, I applied the following tools: all-round market view, Japanese candlestick patterns, market balance level, oscillators, volume profile, key levels.
According to Ethereum fundamental analysis, nothing has changed.
The news background for the second largest cryptocurrency seems to be neutral; against which, an interesting information reference from Foley & Lardner is standing out. According to the US legal firm’s analysts, 41% of respondents are confident that Bitcoin will be replaced in the first place in future. In addition, 38% of respondents believe Ethereum to be the best investment opportunity of all cryptocurrencies.
Considering the fast development of Ethereum blockchain technologies and Ethereum community and the fact that that SEC doesn’t recognize Ethereum as a security, the token is going to be the first.
Although, there is also some negative, suggested by the same Foley & Lardner report. It says that 41% of respondents expect the cryptocurrency market to collapse next year.
This percentage is rather indicative and explains why there are no volumes in the cryptocurrency market and now new cash inflows.
It is a paradox that people’s expectation of a correction, by itself, develops the correction. And next, the quotes drop only increases investors’ fears and confirms the negative expectations.
It is only the greed that can take over the fear. When Ethereum price is corrected down to the levels where the fear of losses becomes weaker than the desire of profits, we can really expect the true trend reversal.
To do it, we need to find out these levels and Ethereum technical analysis will help us.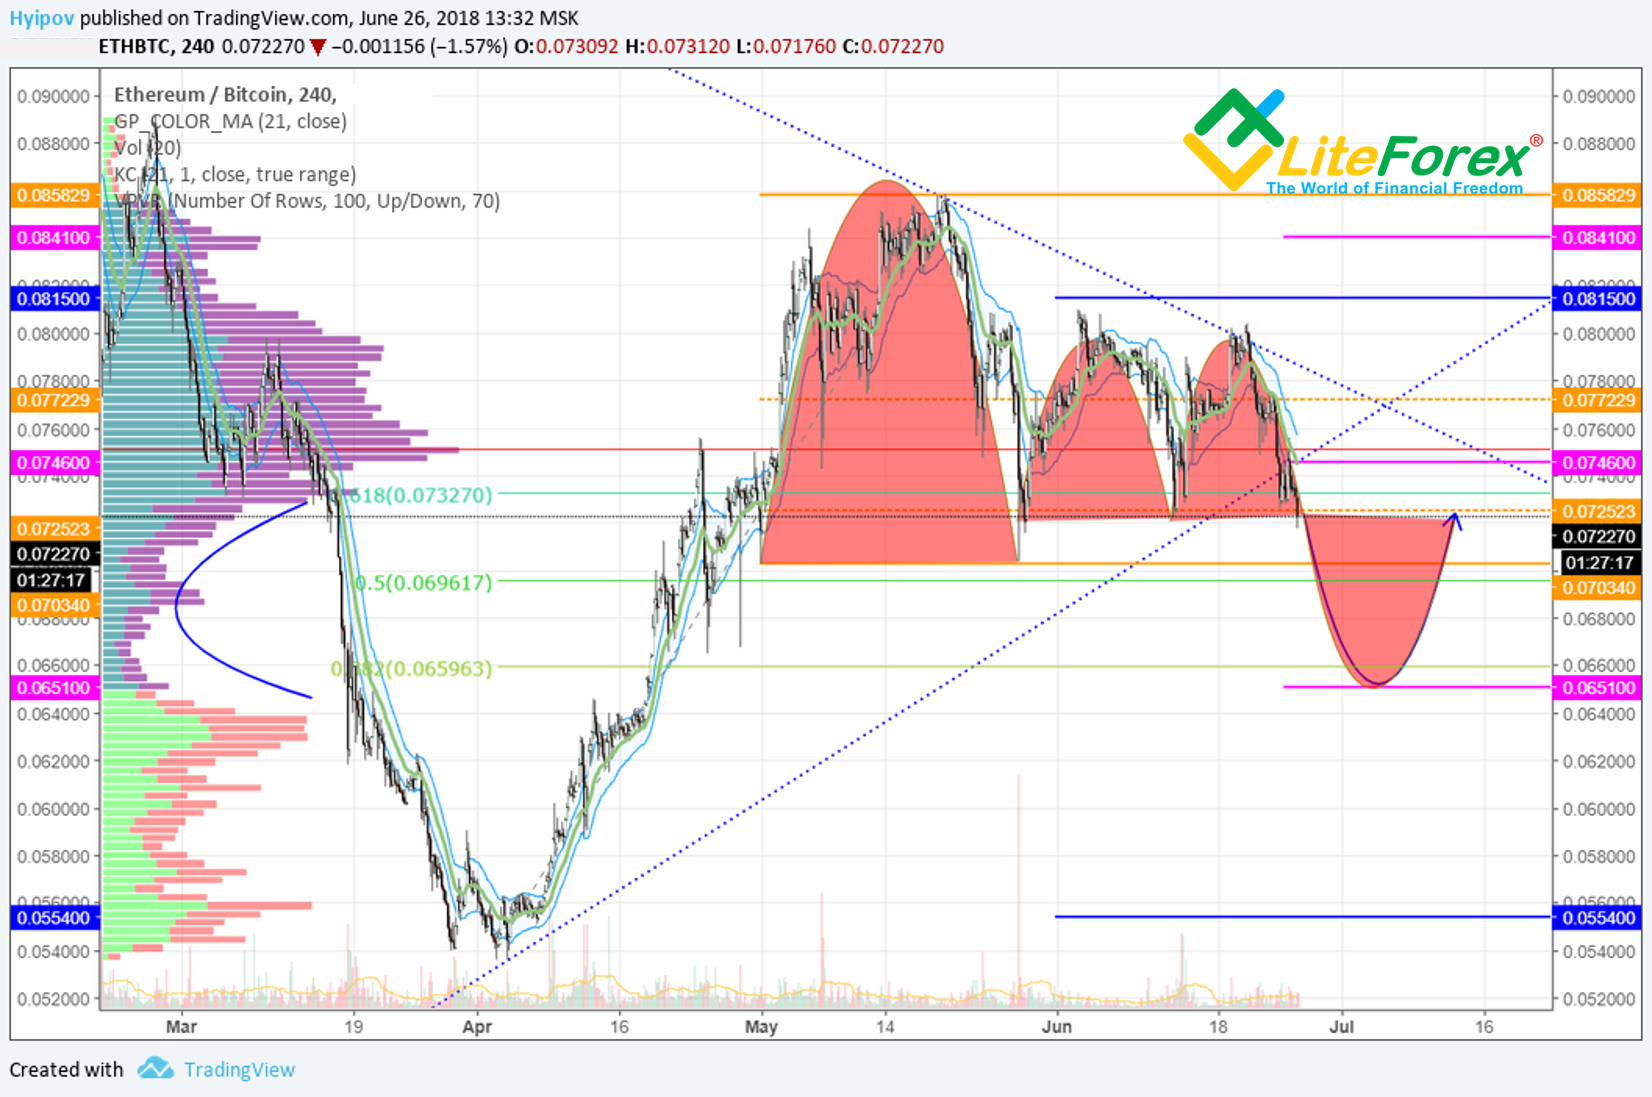
As the last forecast suggested (see Ethereum price chart above), the situation for Ethereum to Bitcoin looked bearish. Most of traders expected correction. The important support level at that time was around 0.0651 BTC.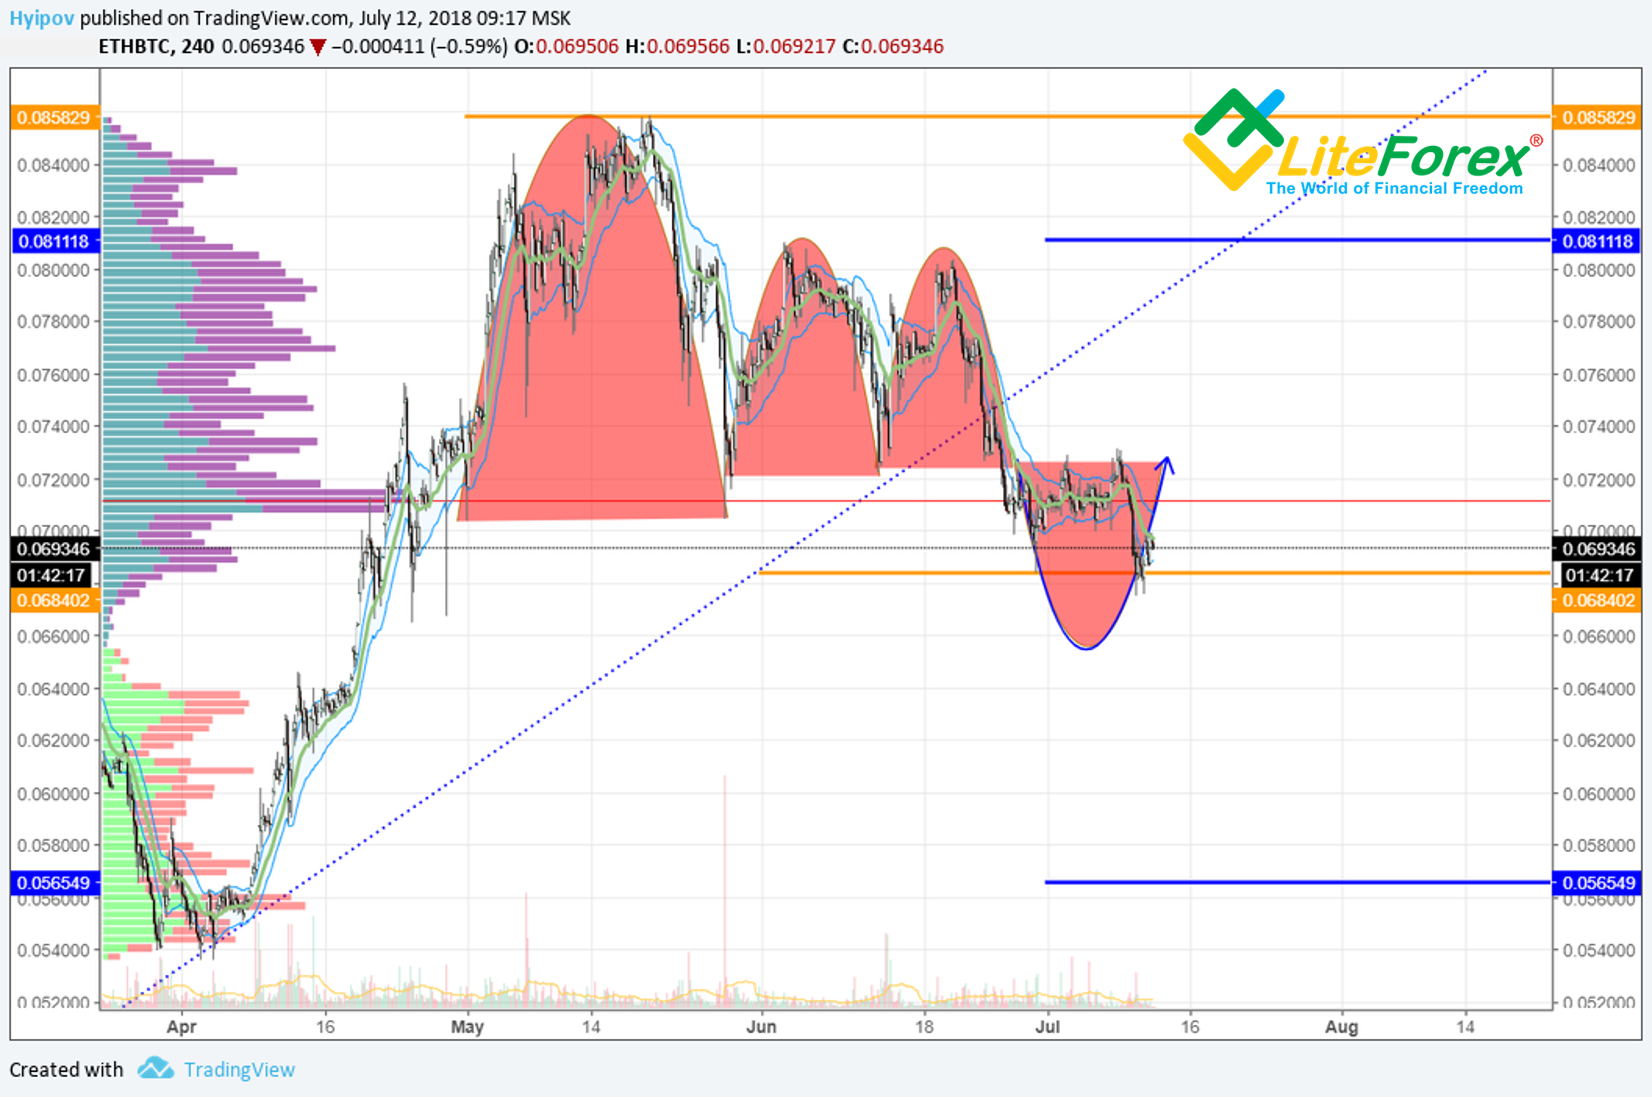
Finally, it turned out to be much more positive than I had expected; the ticker didn’t reach the low at 0.0651, as the Ethereum price rebounded up from level 0.068. On the other hand, the ticker didn’t draw the typical bullish rounding. Therefore, I should update the whole scenario and revise the whole situation.
So, I need to make all-round market view and update the current scenario for Ethereum trading.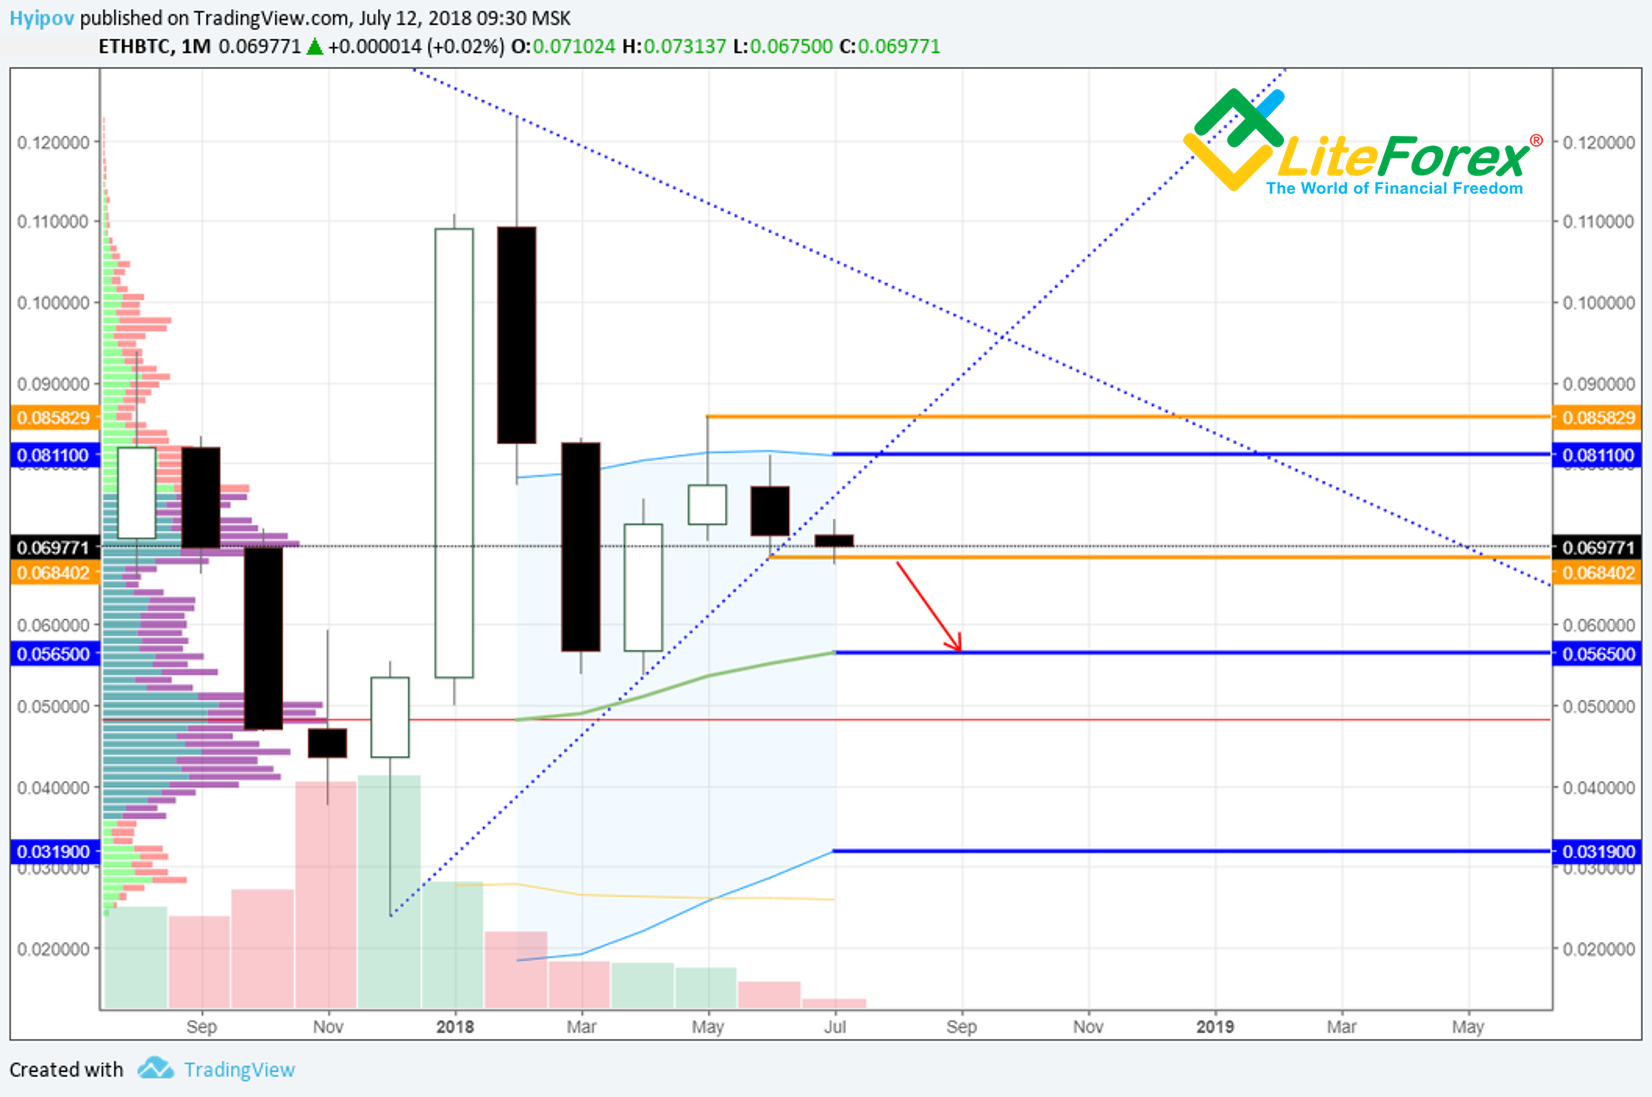
It is clear in the monthly Ethereum price chart above, that June candlestick broke through May’s low, which is a bearish sign. July candlestick is far from complete, but it also indicates the drop below the current lows. It means the buyers are weak at these levels.
June candlestick body and its bottom tail cover the bottom tail and the body of the previous monthly candlestick. The pattern is not complete due to the top tail that in classical candlestick analysis must cover the tail of the candlestick, it engulfs.
In general, the Ethereum monthly chart suggests the bearish market sentiment that sets the tone for my whole scenario for the next month. Here, I can mark an initial target for the correction. I suggest it be around Keltner channel's moving average at 0.0565 BTC.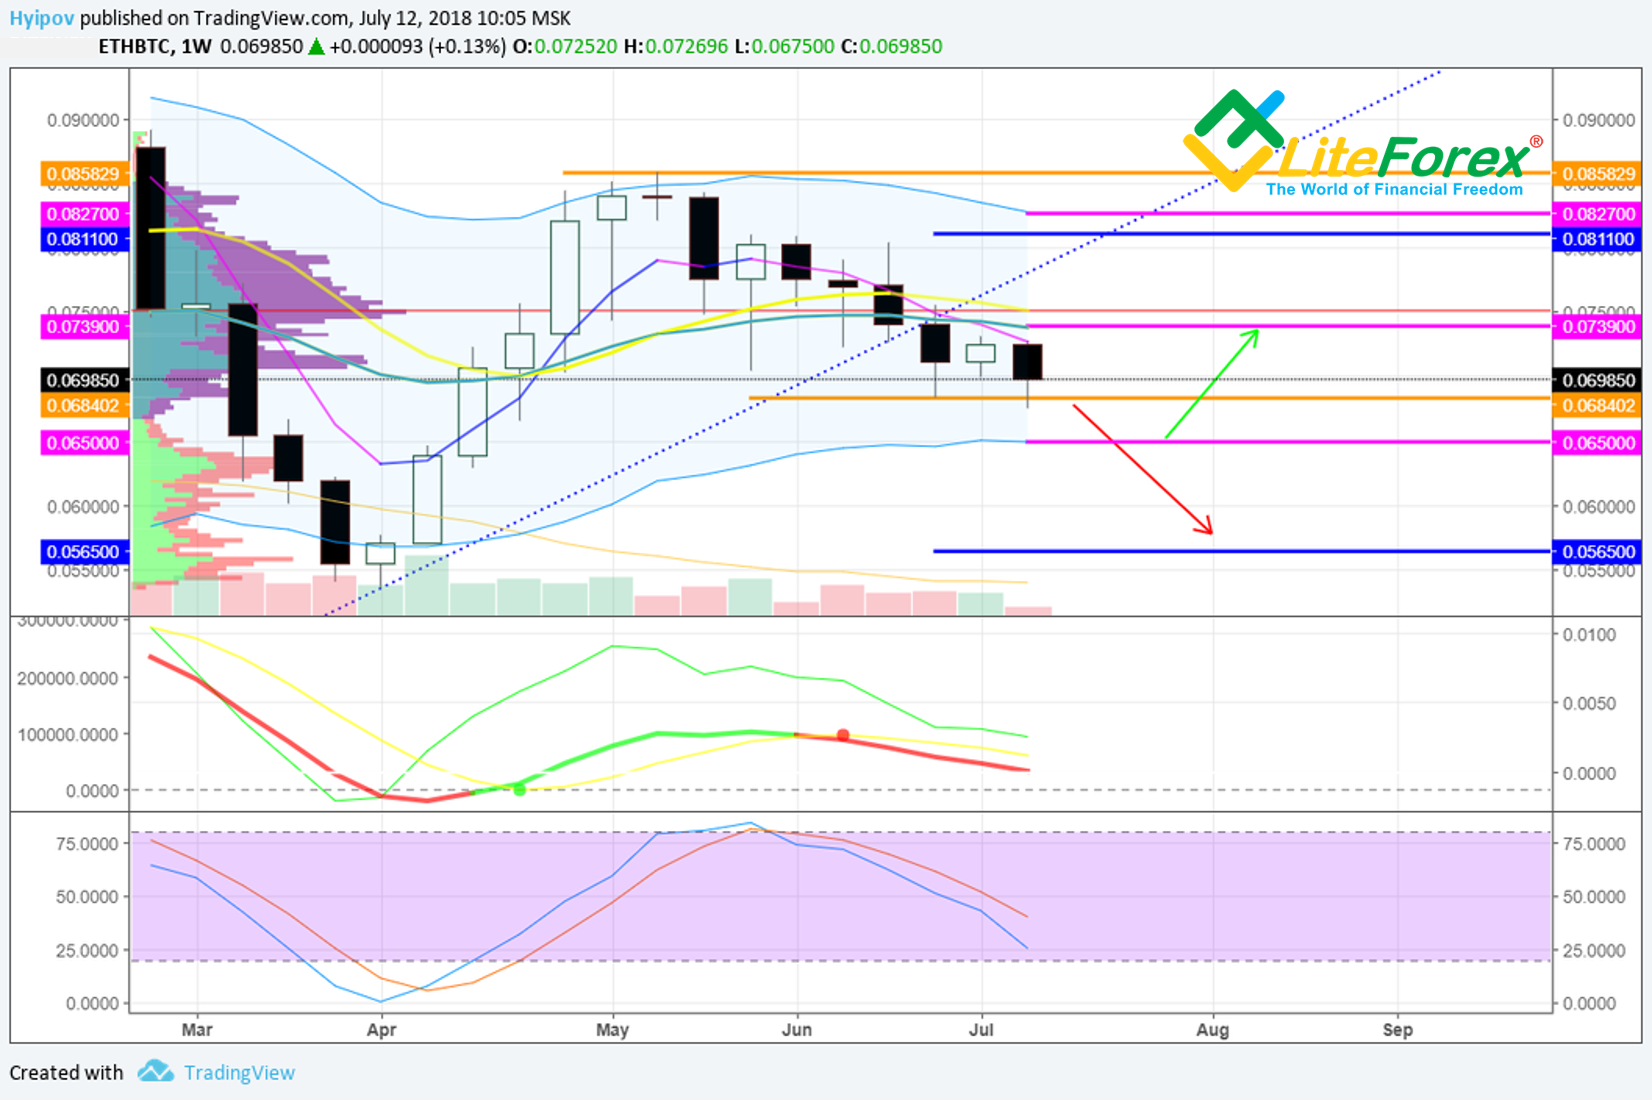
It is clear in the weekly Ethereum price chart that ticker is below Keltner channel's moving average. In addition, I can’t but note the breakout of the ascending trendline, which is especially clear in the weekly chart.
The nearest support level in the weekly chart is Keltner channel's bottom border at 0.065 BTC. Taking into account that RSI stochastic is on its way to the oversold zone, we can expect the price rebound from the level in the near future, followed by the return to the channel's moving average at about 0.073 BTC.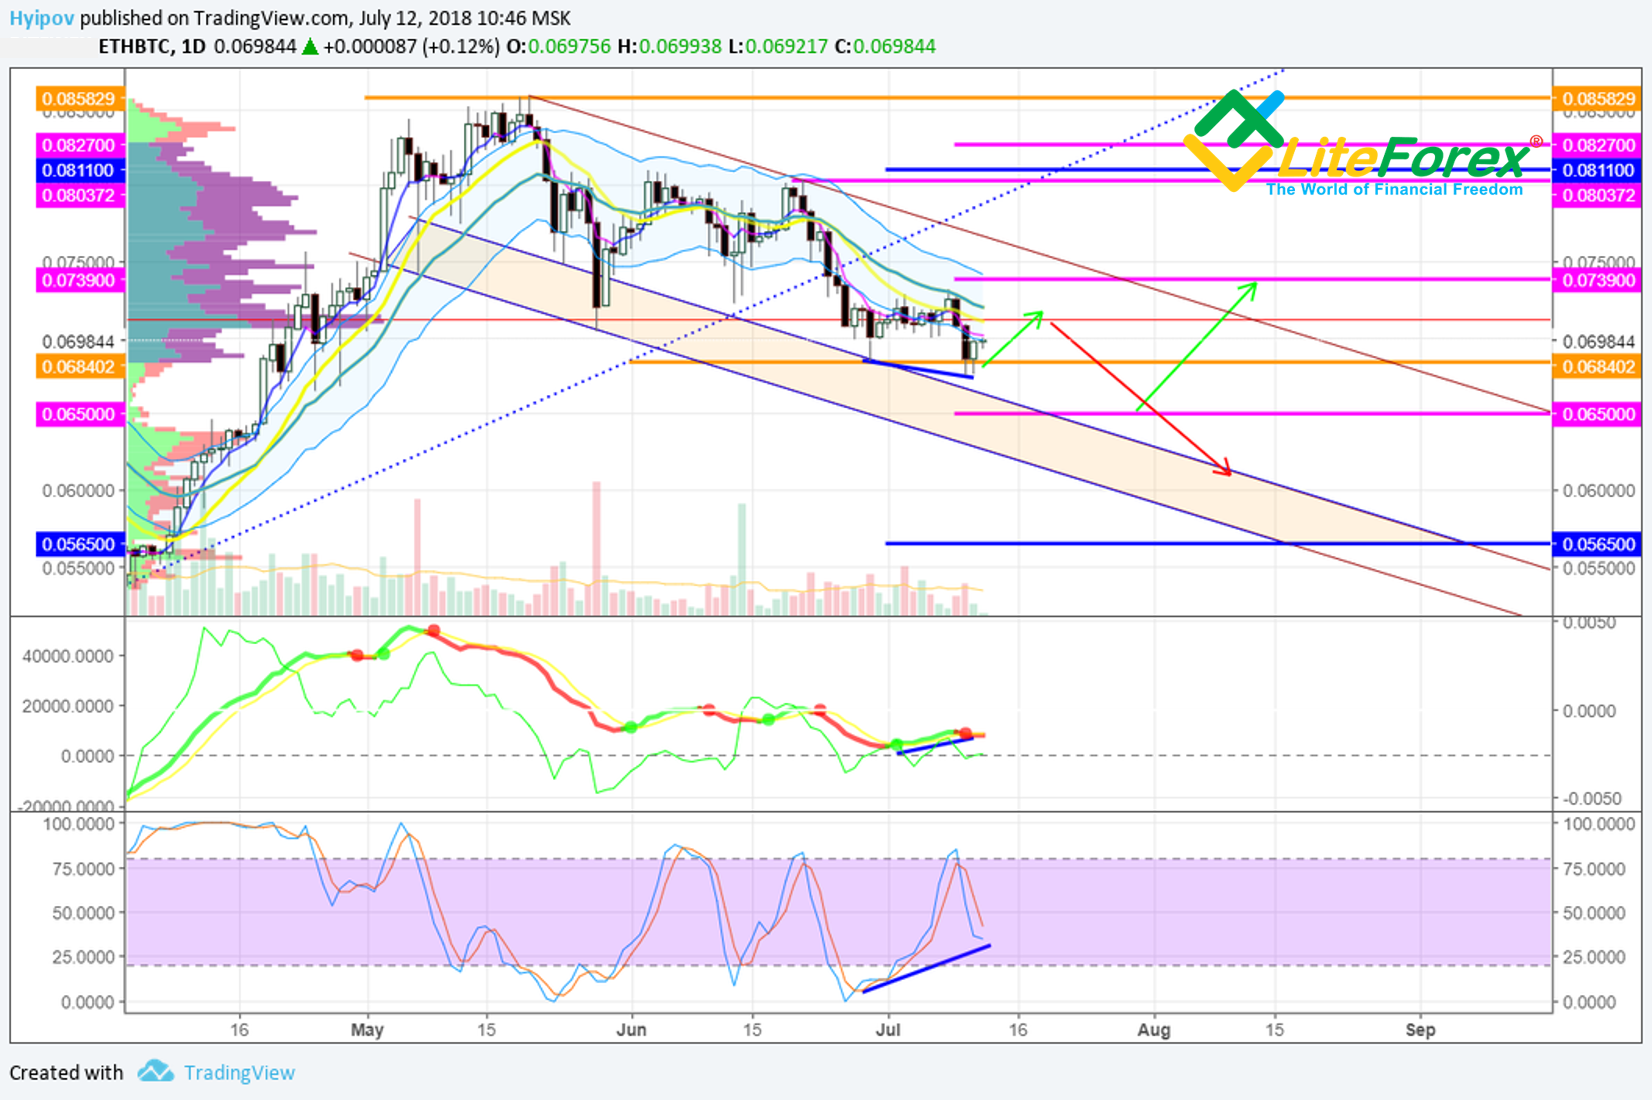
In the daily Ethereum to Bitcoin price chart, there is the price bullish convergence with oscillators; therefore, we can count on a soon rebound on the daily scope.
The point of control in the volume profile is at 0.071. It is the level to be the first support zone in case of bullish correction, and so, it will be the first target for those who want to go long.
In general, the daily timeframe of Ethereum price chart suggests the local bearish channel with a wide support zone; the ticker is close to its bottom border. Any upward move in this situation is rather a point for going short.
Summary: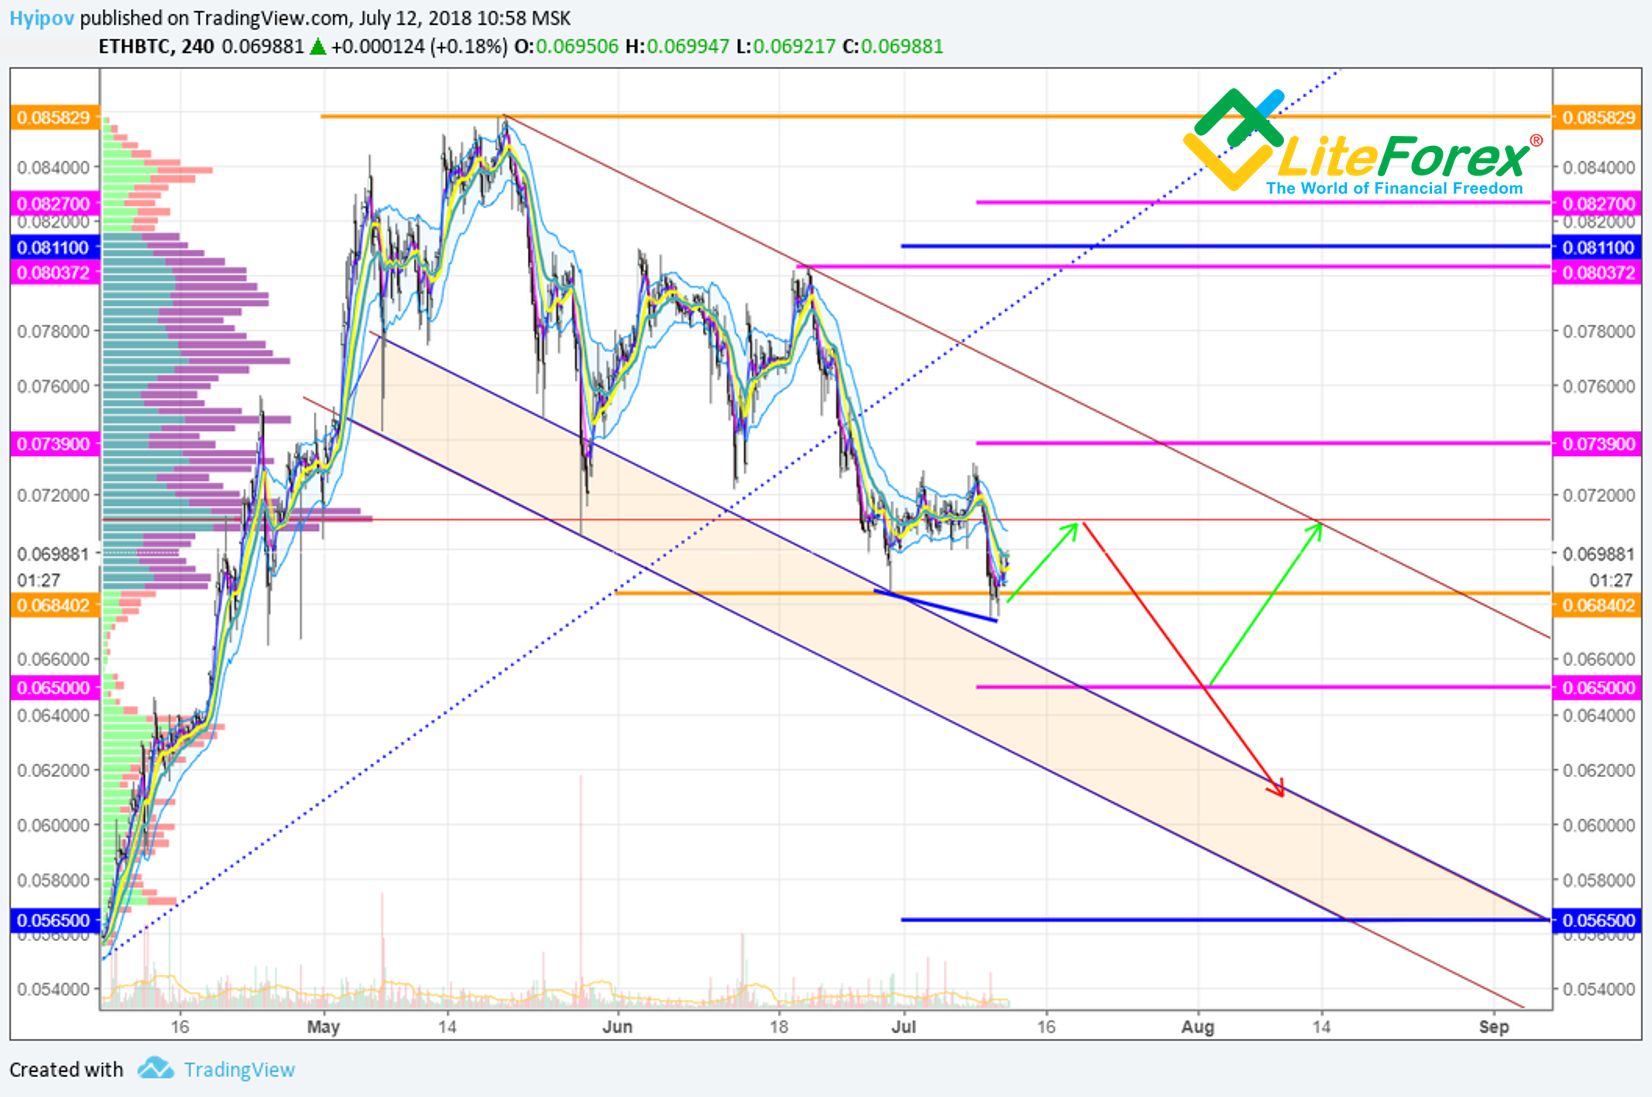
I still suggest bearish scenario to trade ETH/BTC.
The ticker is moving inside a descending channel. The strong pivot signal will emerge only provided that the price goes beyond the channel's top border.
In the current situation, I don’t recommend buying ETH/BTC. Following a slight upward retracement, the ticker is highly likely to continue falling down towards the bottom borders.
The strong support zone is level 0.065 BTC, from which the ticker may rebound within the descending channel.
If the market is weak and, instead of the rebound, there is consolidation, the price is likely to drop deeper. If so, the strong support level is around 0.0565 BTC.Key levels to trade ETH/BTC for the next two weeks
Support levels:
- 0.068 BTC is highly likely to be touched by the price;
- 0.065 BTC is likely to be touched by the price;
- 0.055 BTC can be touched;
Resistance levels:
- 0,071 BTC is highly likely to be touched by the price;
- 0,073 BTC may be touched;
- 0,080 BTC will hardly be touched.
I wish you good luck and good profits!
