Ethereum (ETH) was the first digital asset to introduce smart contract functionality into the blockchain. Using the Ethereum platform, users can develop decentralized applications (dApps).
Bitcoin was the first blockchain-based cryptocurrency. It is considered a first-generation cryptoasset. These are typically called “cryptocurrencies.”
UPDATED ETHEREUM NEWS: Vitalik Buterin, Founder of Ethereum, Denies Claims that He Legitimized Bitcoin SV
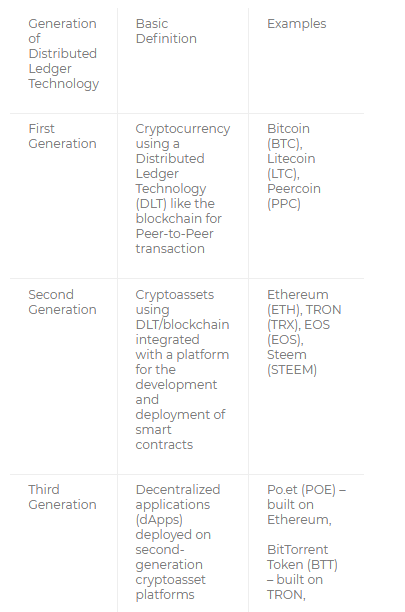
When Ethereum first introduced smart contracts into the blockchain, the second generation of digital assets emerged.
Other second-generation digital assets include EOS (EOS), Tron (TRX), NEO (NEO), Waves (WAVES), Steem (STEEM), and Cardano (ADA). They each have a native cryptocurrency deployed on their network as well. Ethereum’s native cryptocurrency is called “ethers”
While Ethereum maintains the highest market cap of any second-generation digital asset, its competitors may post threats in the future. Compared to Ethereum, many have increased scalability, lower transaction fees, a more easy-to-use interface, more-developed networks, and other advantages.
In this article, we assess the competitive advantage of Ethereum in a fundamental analysis. Following this, a technical analysis is performed in an attempt to predict future possible price levels for ethers.
We begin, however, with a summary of our regular price analysis of Ethereum:
Regular Price Analysis of Ethereum (ETH)
At BeInCrypto, we offer regular price analyses and predictions of the most popular and relevant cryptoassets. We completed a monthly analysis of Ethereum’s price fluctuations and trends throughout March here. In addition, we predicted prices throughout April at the beginning of the month here. Below is a summary of our most recent short-term price analysis and predictions for Ethereum published on Apr 24, 2019:
Ethereum reached a high of almost $190 on Apr 8. It has been on a downtrend since. It is trading inside the descending channel.
The channel is shown in the chart below along with one support area:
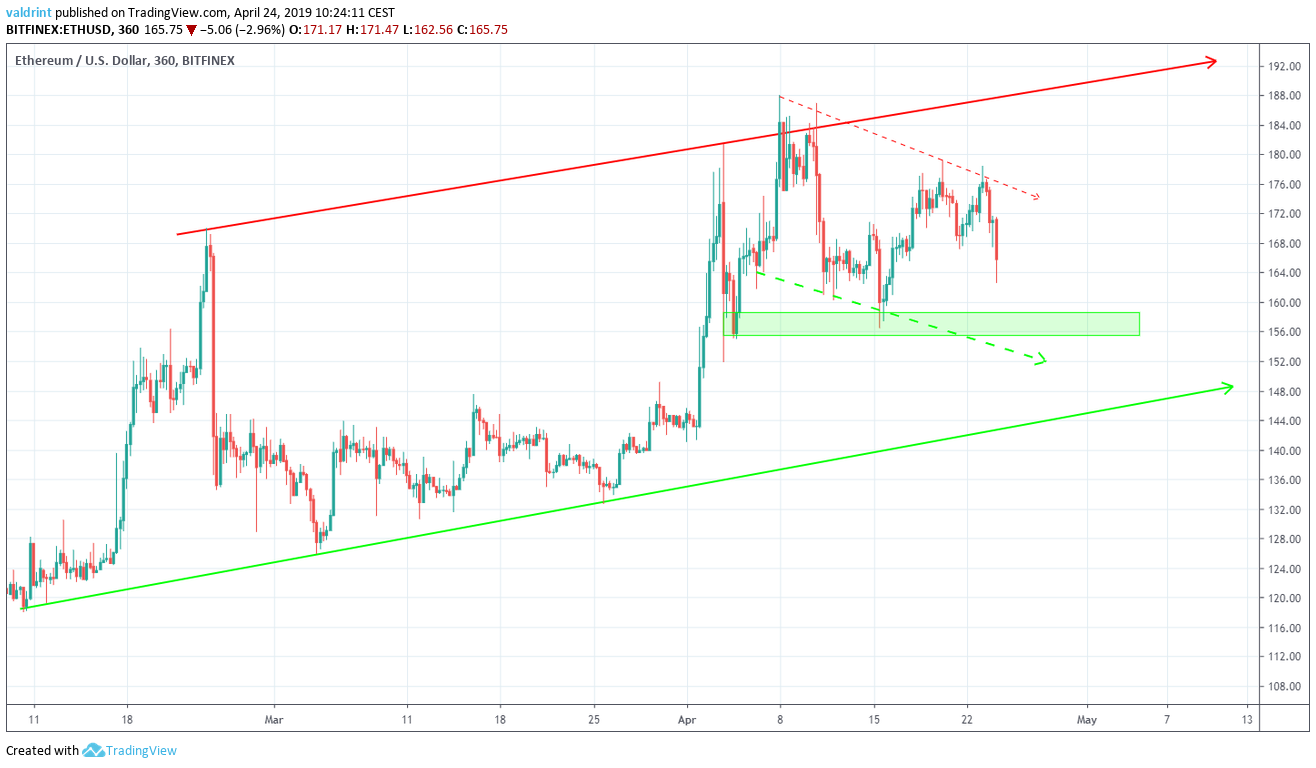
Ethereum’s price is likely to drop toward the support area of around $156, coinciding with the support line of the channel.
This means that Ethereum’s price may dip into the $150s by week’s end.
Furthermore, the price is trading inside a longer-term ascending channel. We believe the price will eventually reach the support line of this channel at $145.
To read our full Apr 24 price analysis in both ETH/USD and ETH/EUR, click on the green button below:
Fundamental Analysis
From a fundamental perspective, Ethereum (ETH) has shown signs of relative weakness in 2019. It’s Constantinople hard fork was delayed in Jan after a previous postponement in October 2018.
Though it successfully forked on Feb 28, not until about a week later was it receiving much coverage in the media.
Furthermore, the platform still hosts high gas fees for transactions while competitors like Tron have no transaction fees.
This combined with scalability issues and other problems have left Ethereum with many dApps and few users. Tron, EOS, and Steem have deployed more active dApps than Ethereum. These four may be contenders in the dApp race, Ethereum appears to be losing.
Proof-of-Something
Ethereum was initially released using a Proof-of-Work (PoW) consensus algorithm. Similar to Bitcoin (BTC), Ethereum used PoW to validate transactions on the blockchain. The plan, however, was to shift to a Proof-of-Stake (PoS) protocol.
A roadmap was released to describe how the Ethereum mainnet would undergo a number of hard forks until PoS was attained. Below is a list of planned forks along with the date and block number at which they occurred:
|
ETHEREUM’S PLANNED HARD FORKS (ACCORDING TO ROADMAP) |
||
|
NAME OF HARD FORK |
DATE OF HARD FORK |
BLOCK AT WHICH FORK OCCURRED |
|
Frontier (initial mainnet release of Ethereum) |
July 30, 2015 |
Ethereum genesis block mined; no hard fork occurs |
|
Homestead |
Mar 14, 2016 |
1,150,000 |
|
Metropolis – Byzantium |
Oct 16, 2017 |
4,370,000 |
|
Metropolis – Constantinople |
Feb 28, 2017 |
7,280,000 |
|
Serenity |
To be Announced |
To be Announced |
Five updates were initially announced to occur with the Constantinople hard fork. A vulnerability discovered in one of the updates caused Constantinople to be delayed—it was initially to take place at block 7,080,000.
The four current updates decrease transactions fees, increases ease-of-use of the Ethereum network, and enables users to interact with future addresses yet to be created.
Most notably, it decreases the mining reward and delays the difficulty bomb—which is designed to make mining next to impossible following the shift to PoS.
A full PoS consensus algorithm may be implemented with Serenity.
Learn More About Ethereum’s Hard Forks Here!
Centralized Control
In a piece about the delay of the Constantinople hard fork, Jon Buck writes:
“Unlike Bitcoin, which can only soft fork on the main chain through complete miner consensus, Ethereum has a more centralized approach. It allows the developers and core team to make, what appear to be, relatively centralized and arbitrary decisions for the platform without widespread user approval.”
In other words, the centralized control of the Ethereum Network by the Ethereum Foundation led them to delay the hard fork without necessarily receiving consensus from the community.
This violates the basic principles of decentralization upon which Bitcoin is built.
However, Ethereum is not Bitcoin, and if the delay had not occurred, a vulnerability in one of the updates could have been exploited.
This would have possibly allowed bad actors to steal user funds. On other words,the centralized governance of the Ethereum Foundation may have ultimately prevented thefts or fraud.
Nonetheless, the discovery of the vulnerability, however, did not come from the Foundation or the Core Developers. ChainSecurity discovered the vulnerability on Jan 15, 2019—only days before the hard fork was projected to occur.
Unable to fix the vulnerability in time, the Foundation chose to delay the fork. The centralized business model the Foundation would have unable to do this had other entities not chosen to disclose their findings.
The users on the network might have reached consensus to delay the hard fork, but they were not given a choice. Decentralization typically catalyzes democratic participation. Both seem absent from Ethereum’s business model.
On the contrary, centralization has appeared to develop in a traditionally corporate-esque Foundation. An authoritarian governance structure prohibits decentralization.
Losing the dApp Race
Ethereum is a second-generation cryptoasset. This means that it includes a platform in which smart contracts can be designed, built, and deployed. With smart contract enabled blockchains, decentralized applications (dApps) can be developed.
Dapps are like traditional apps except there is no centralized authority, data storage, or intermediary. The users who actually use the dApps are the owners of the servers.
In an article written about the differences between lApps, dApps, and apps, we explained that a social media dApps would act similarly to social media app. Unlike Facebook (NASDAQ:FB) or Twitter, however, the users who use the dApp are the actual owners. Furthermore, they may be rewarded for sharing, liking, and posting on the platform.
Everything that occurs on the dApps is recorded on a ledger which is distributed publicly. Typically, the personal data remains in the possession of the person who owns it, not one centralized authority or metadata storage facility.
Ethereum currently has the most dApps built on its platform. However, these dApps are not necessarily being used that often. According to dApp radar, dApps built on TRON and EOS appear to be outperforming Ethereum in terms of 24-hour users.
At the time of writing, the top 13 most used dApps in the last 24 hours were built on either TRON or EOS. Ranking in 14th, My Crypto Heroes in the top 25 of the most used dApps.
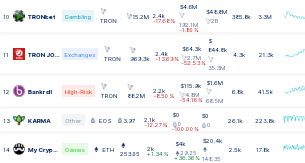
At the time of writing on Mar 24, My Crypto Heros was the only Ethereum-based dApps ranked in the top 25 most used dApps in the last 24 hours according to dApp Radar.
While Ethereum may still have the highest market capitalization, there are other matrices of performance. The overall usage of dApps on a platform developed for the deployment of dApps is perhaps a more important indicator of that platform’s actual performance.
If mass adoption of cryptoassets is expected, then the cryptoassets must actually be used not just exchanged. Thus, TRON and EOS may have a competitive advantage over Ethereum. In any case, the competition between these three cryptoassets is liable to become more significant as the cryptoasset market grows.
Technical Analysis
On Oct 22, 2015, the price of Ethereum (ETH) made a low of $0.41. Price increased with highs of over $20 reached in late June 2016.
This move was followed by a steady downtrend. Ethereum experienced lows under $6 before the end of the year. Another price increase followed with highs of over $1400 reached in January 2018.
The price has been on a downtrend since—making a low of $75.40 on Dec 6, 2018.
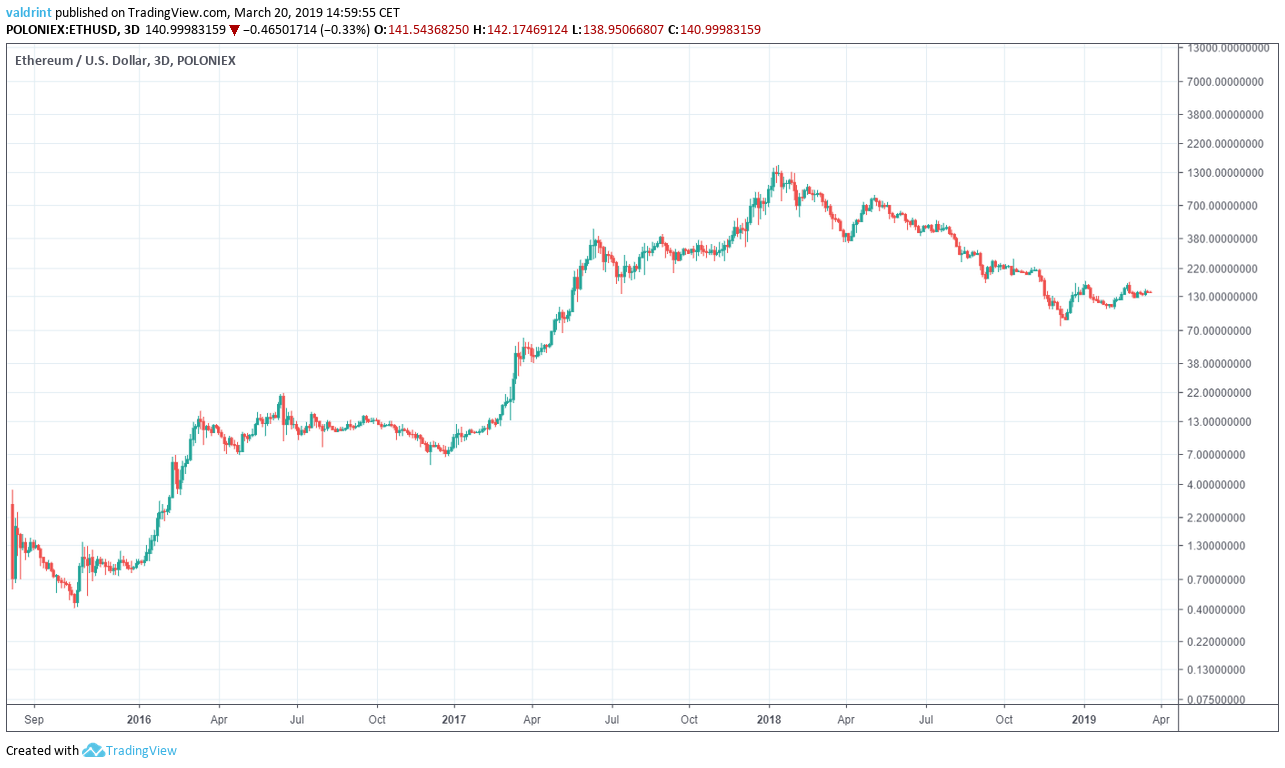
There have been three significant downtrends since Oct 2015. At each bottom, a higher low was experienced than during the last bottom.
Furthermore, after the first two, rapid price increases followed over a considerable period of time. In each case, higher highs were experienced at the peak of the respective rise.
Given that the third bottom was experienced only in December of 2018, it appears we may still be at the beginning of a third rapid upward trend. In the table below, we see the three upward trends defined. The low bottom and peaks experienced are isolated.

Since the bottom experienced in December 2018, prices have increased. A high of $148 was reached on Mar 16, 2019. Based on this information, we believe that Ethereum will reach a high significantly higher than $1469.
In this analysis, we attempt to predict what that high will be and when it will be reached. As well, we highlight the prices we expect to see at the end of 2019 and 2020. Lastly, we examine the specialist’s perspectives to help determine possible long-term prices.
Seeking Similarities
To begin, we seek to isolate similarities between these upward trends within the technical indicators. The first similarity is the pattern we isolated above:
- A bottom is reached.
- Longitudinal rapid price increases lead to a peak.
- Longitudinal price losses follow.
- A higher bottom than the previous bottom is reached.
- Another rapid price increase leads to a higher peak than the previous peak.
This pattern appears to be on its third upward trend.
Another similarity we see between these three events is a low relative strength index (RSI) ratings during each bottom. To help us better isolate the RSI, we examined the price of ETH and its RSI on Poloniex at three-day intervals from Jul 2013 to Mar 2019.
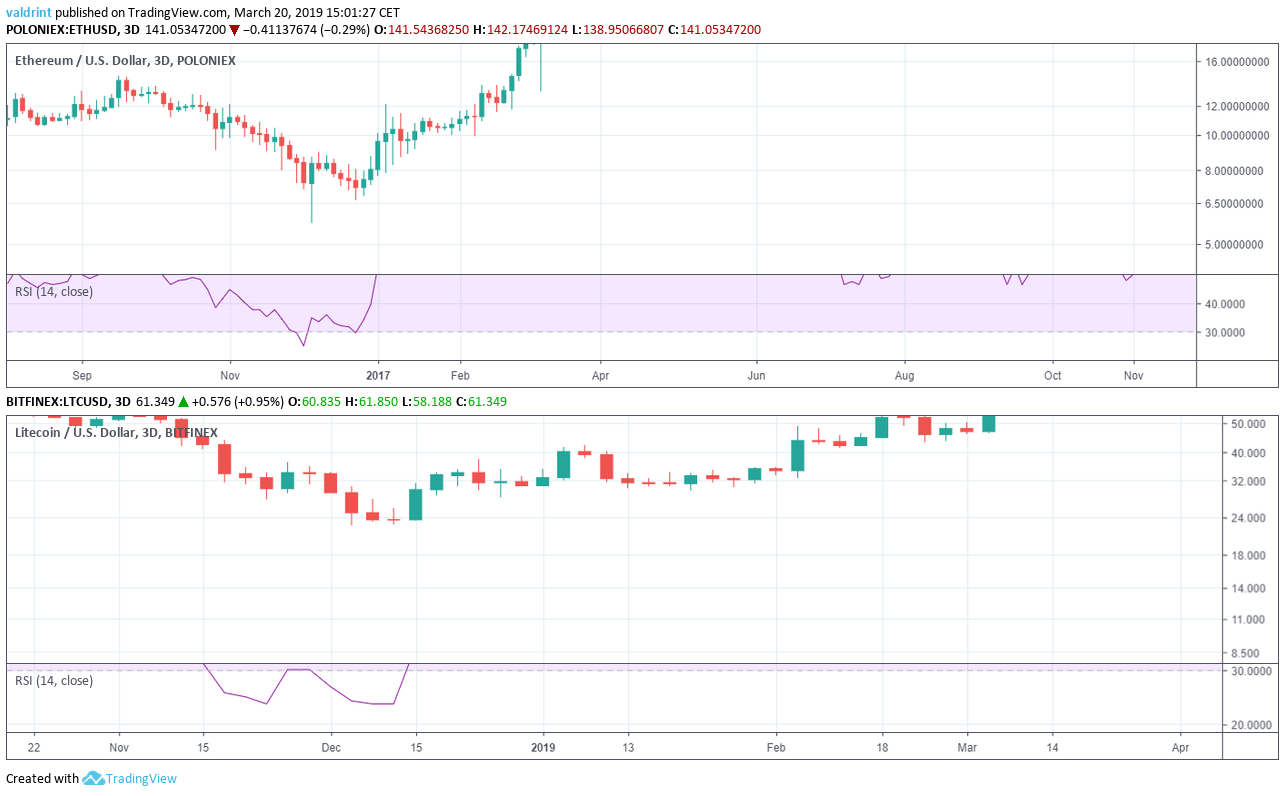
In order to better visualize large price fluctuations, logarithmic charts are going to be used in this analysis.
The RSI is an indicator which calculates the size of the changes in price in order to determine oversold or overbought conditions in the market.
During the 2015 correction, the lowest RSI value recorded was 25. It occurred only several weeks before price bottomed out.
An RSI of 25 was also reached on on Dec 2, 2016—three days before the second bottom. In addition, a slightly lower RSI of 22 was reached on Dec 12, 2018—only six days after the third bottom.
This suggests that RSI reaches similarly low levels between 22-25 shortly before or after Ethereum bottoms out after a significant long-term downtrend. After these lows were reached, we saw subsequent price increases with new highs reached.
This gives us three reasons to believe that ETH is currently on an upward trend that will eventually lead to new highs:
- Ethereum’s price is now rising after reaching a bottom higher than the previous bottom—the Mar 16, 2019 high was nearly twice that of the Dec 12, 2018 bottom
- A low RSI was experienced during this third bottom—just as during the other two bottoms
- Ethereum has not yet reached a high higher than the previous high.
There are some dissimilarities, but they are minor. First, in this instance the low RSI occurred after the bottom rather than before—as it did during the other bottoms. Second, the RSI was slightly lower than during the other two figures.
This simply means a low RSI may occur before or after a bottom is reached. In every instance, however, there is only a short period between the low RSI and price bottom. Furthermore, an RSI of 22 is not significantly different from 25. Using the three figures together, an average RSI low of 24 could be used to assess when a bottom for Ethereum may have been reached.
Based on these patterns, a fourth bottom is not expected until the third rise peaks. A reversal is then expected leading prices to a low higher than $74.50—which was the last bottom.
This information alone, however, tells us neither when the peak will occur or how high it will be. Thus, we are also unable to yet predict when the fourth downward trend should begin.
Time Periods
233 days passed between the bottom on Oct 22, 2015 and the high on Jun 14, 2016. A 177-day downtrend followed. On Dec 5, 2016, an upward trend lasting 401 days before the Jan 13, 2018 high was reached. 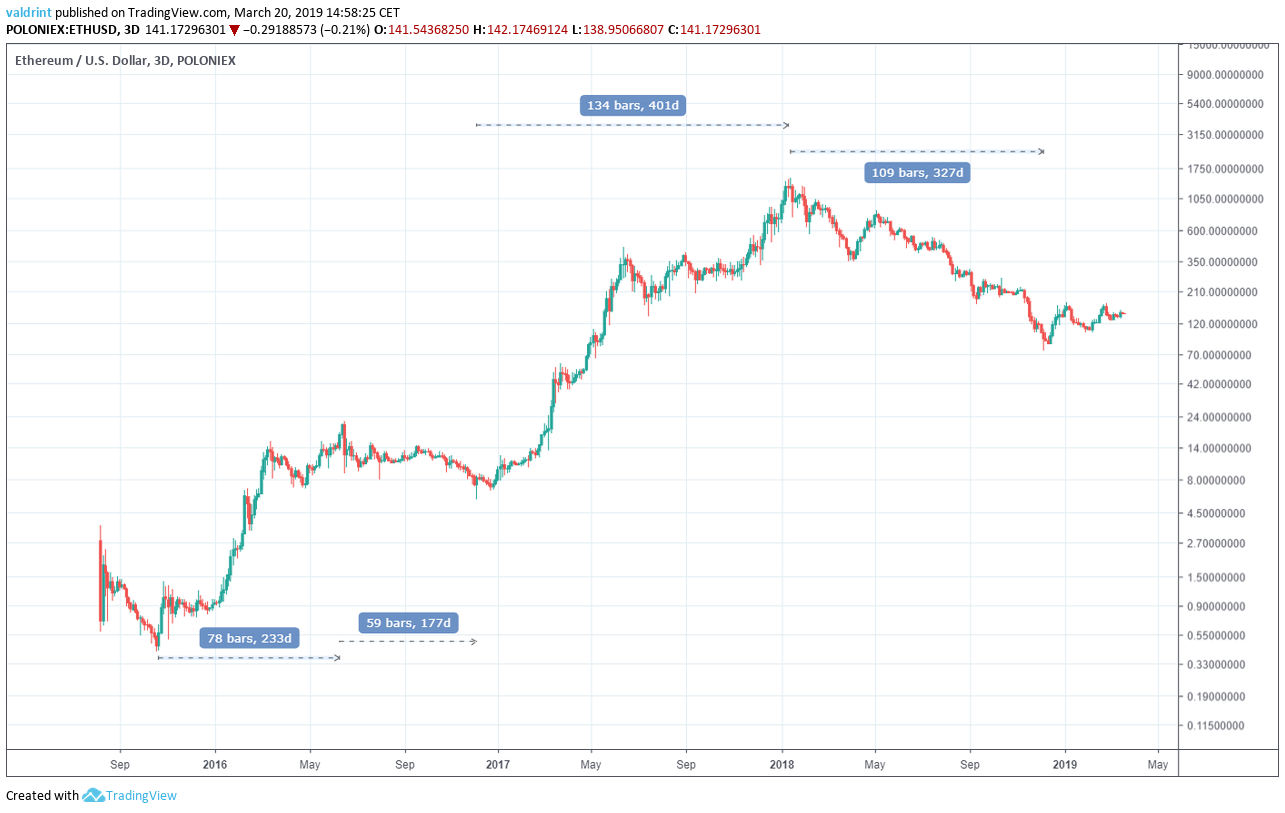 Comparing the upward and downward movements between the second and first downward trends allows us to generate ratios that may help us evaluate future prices and when they will be reached.
The ratio for the upward trend is 401:233 or about 1.72.
The ratio for the downward trend is 327:177 or about 1.85.
The average between these ratios is around 1.785 which we round up to 1.8 for the sake of ease and convenience.
Ethereum Price Prediction 2019
In order to find the price at the end of 2019, we are going to use the 1.8 ratio to find the date in the 2016 correction which corresponds with Dec 31, 2019. This will help us to determine the possible future price at the end of this year.
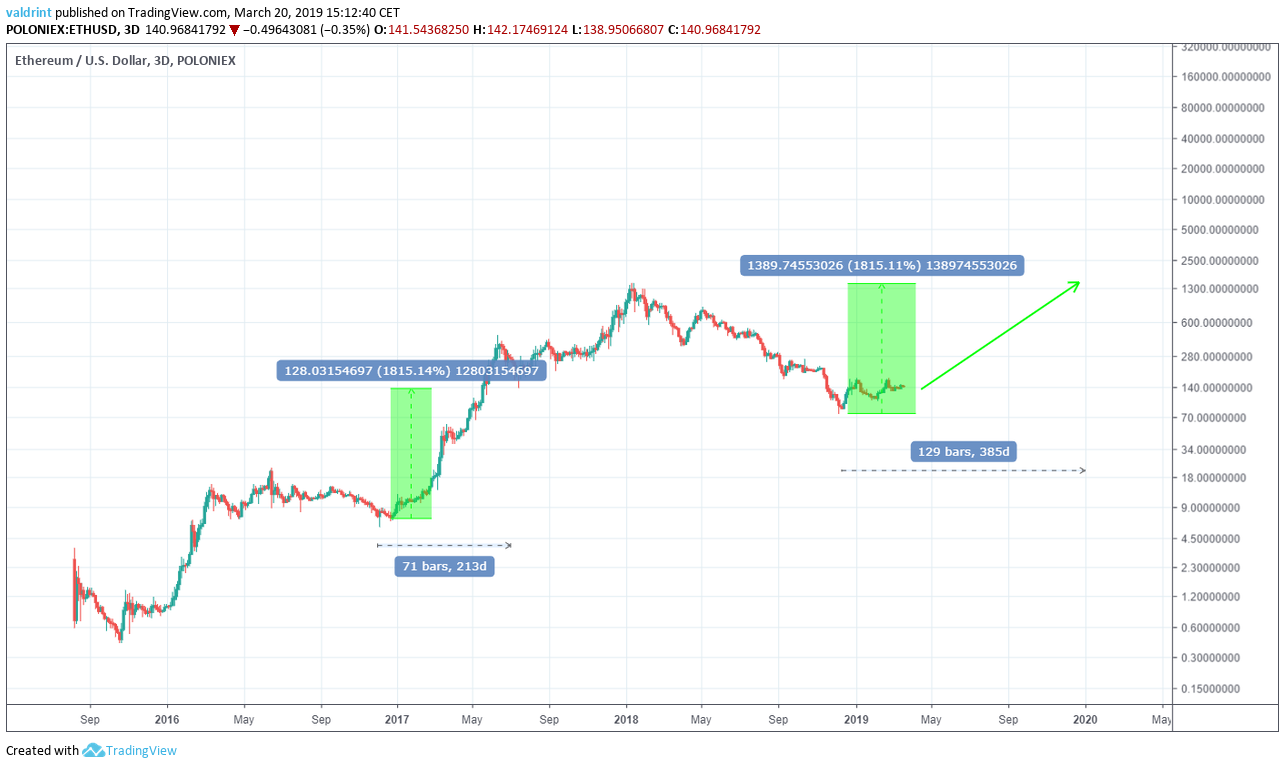
On Jul 3, 2017—213 days after the $5.70 low in December 2016—Ethereum was trading at $244. This amount to an increase of around 1800.%. Therefore, we use a 1800% rate of increase measuring from $75.40 bottom experienced in December 2018.
Doing so, we predict that Ethereum will reach prices around $1400 by the end of 2019.
This, however, does not mark the end of the current upward trend. Based on the patterns defined, higher prices are still expected to be reached in 2020.
Ethereum Price Prediction 2020
In order to find the price at the end of 2020, we use the same ratio in order to find the date in the 2016 correction which corresponds with Dec 31, 2020.
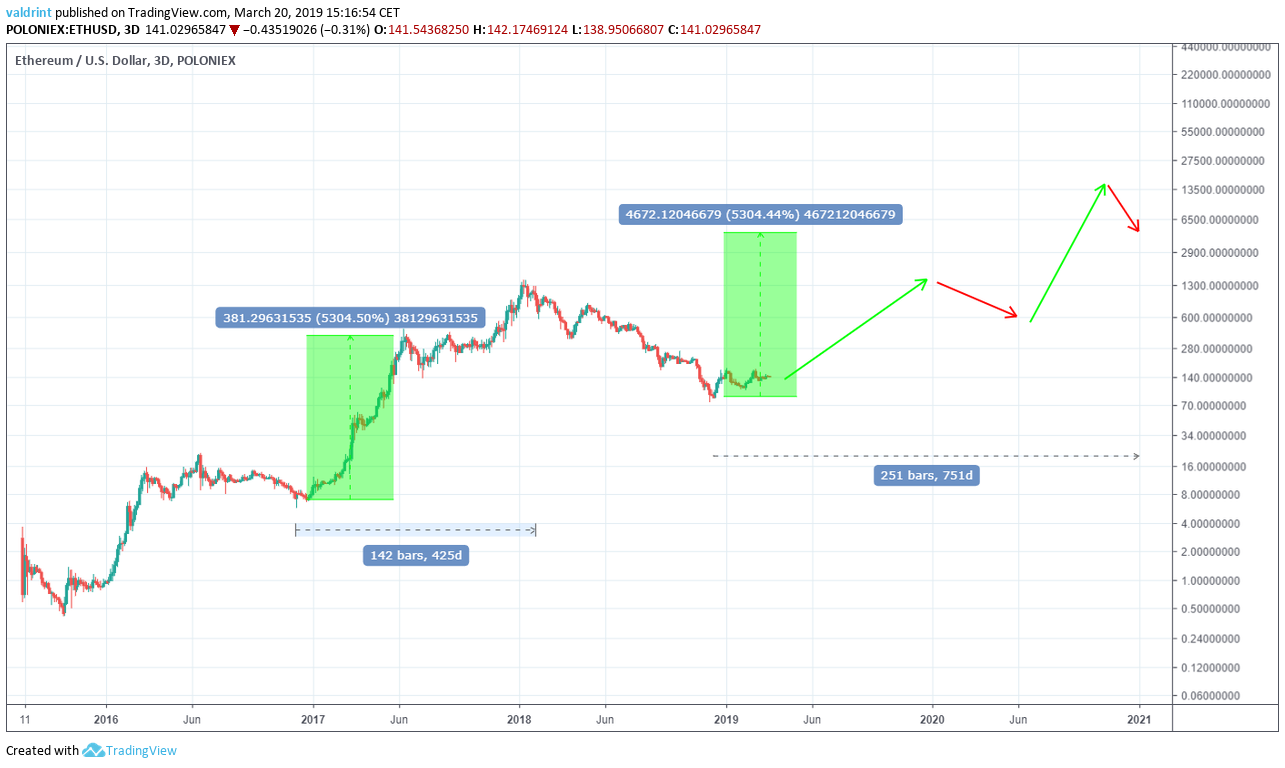
On Feb 3, 2018—425 days after the $5.70 low—the price was trading at $636. Measured from the $5.70 low, this is a 5300% rate of increase.
Therefore, we use a 5300% rate of increase measured from the $75.4 low in order to arrive at prices around $4,600 by the end of 2020.
Ethereum Price Prediction 5 Years
We have predicted that the price at the end of 2020 will be around $4600. However, it is visible in the previous chart that the price is occurring at the beginning of a downtrend.
A higher price is reached before the end of 2020. This will mark the end of the third upward trend.
The Third Peak
In order to determine when this date will occur, we measure the number of days from the $5.7 low to the $1400 high. Then we use the 1.8 ratio to find the equivalent day starting from the $75.40 low.
We also use the same rate of increase—17200%.
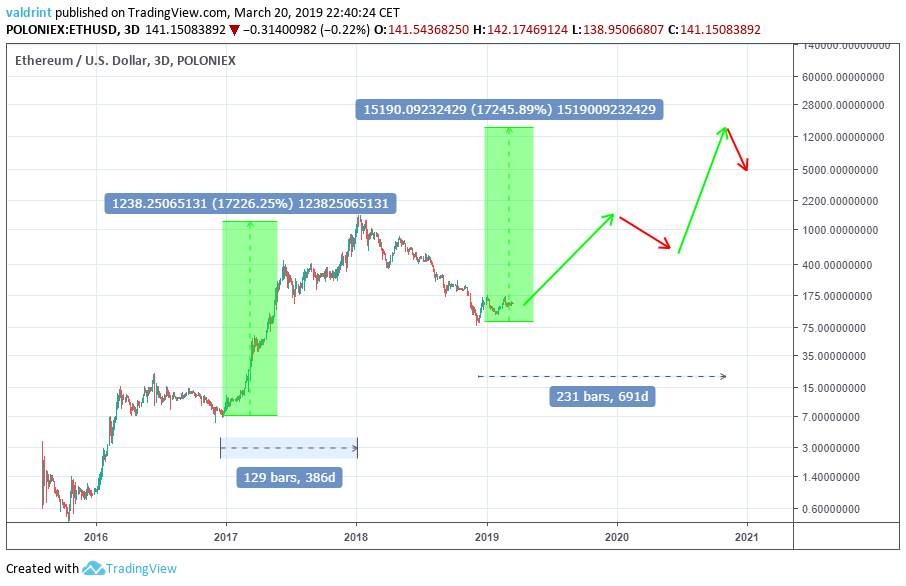
Using the aforementioned numbers, we arrive at an all-time high price of around $15,000 at the beginning of November 2020.
Within two months, a rapid correction should bring prices to around $4600 at the end of 2020—a significant loss from the future high but a significant gain for HODLers.
The End of The Downtrend
Though much of ETH’s value is expected to be lost soon in the first few months after the third peak, a bottom should not be reached until 2022.
We determined this by measuring the number of days from the $5.70 to the $75.40 low. Then, we used the 1.8 ratio in order to find the equivalent date starting from the $75.40 low. Lastly, we apply the rate of increase from the $5.70 to the $75.4 lows, which is 1000%.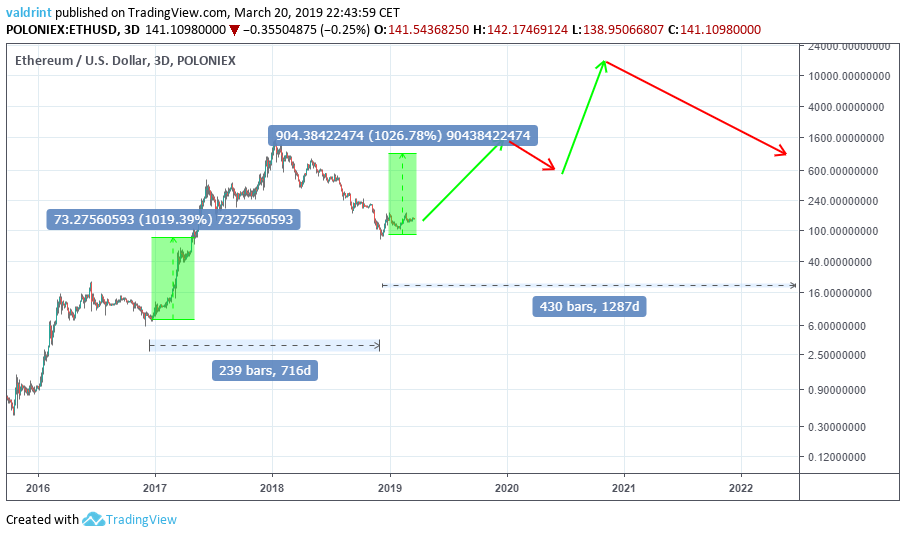
Using the aforementioned numbers, we arrive at a low of $950 on Jun 5, 2022. Such a number also confirms our original hypothesis that the peak of the third upward trend and low at the bottom of the fourth downward trend should both be higher than previous respective peaks and bottoms. Furthermore, this should mark the end of the fourth period—meaning that we also expect to see an RSI around 24 soon before or soon after the low is made.
Price Prediction Summaries
There are several similarities between the 2016 and 2017 corrections—namely the values of the RSI, the length of time taken to generate downward movement, and rapid price increases preceding gradual decreases.
The following predictions are made with the assumption that price will follow the pattern laid out in the previous correction and on the time tables we defined:
- Ethereum will be trading close to $1400 around the end of 2019
- An all-time high around $15,000 near early November 2020.
- The price of ETH should drop to $4600 on Dec 31, 2020.
- Price losses should continue until around June 2022 when price should bottom out around $950.
- A fourth rise should then commence. The expected values can be assessed as these predictions are validated.
What do you think of our ETH price prediction in 2019 and our Ethereum forecast for the future? Do you think ETH can recover in 2018? Let us know your thoughts in the comments below!
Disclaimer: The contents of this article are not intended as financial advice, and should not be taken as such. BeInCrypto and the author are not responsible for any financial gains or losses made after reading this article. Readers are always encouraged to do their own research before investing in cryptocurrency, as the market is particularly volatile. Those seeking advice should consult with a certified financial professional.
