Having cut my teeth with High-Yield (Junk) bonds back in the heyday of the era, when Drexel Burnham and Michael Milken ruled the kingdom from the famous X-shaped Beverly Hills trading floor (with Milken holding down the center point) and annually feted courtiers with what later became dubbed “The Predator’s Ball” (if you haven’t heard of this, do some Googling — it’s an amazing story). I know how those sausages are made and have not been a fan of this asset class. But on scanning the list of Junk Bond ETFs produced by the PortfolioWise screener, I spotted three interesting variations on the theme: ETFs that invest in senior loans. I’m not about to suggest that anybody back up the truck here. But no matter how many times advisers and gurus counsel against yield hogging, the reality is that many will do it anyway (understandably given how low rates still are). If you or your client is, in fact, insisting on junk, at least give these ETFs a good once over.
Risk, Risk, More Risk, And Some Return
Obviously, credit risk is present. How much of a problem is less obvious. I gave up looking at default rates back when I was managing a junk bond mutual fund given my sense that published data was junkier than the bonds. It seemed to me that the way default rates were kept at or below 4% was that they (whoever “they” were) stopped counting as soon as the tally for the year reached 4%.
Seriously, there was one year that I knew of and could name enough busted issues to have made up more than 4% of the market. Then, I realized that the default rate was the right answer to the wrong question. Default is a legal event, a missed payment or breached covenant. These, are indeed, rare. That’s because terms get changed (“restructured”) when default seems imminent but before it actually happens — but after the securities have already plunged as far as they would have been had there been an actual default.
Whether or not one wants to count a troubled issue as a full-fledged default, the important thing to understand is that there’s an inherent human bias toward smoothing when it comes to forecasting. Boom times often turn out better than the most optimistic forecasts. Bad times, on the other hand (and this is what we need to be thinking about now) often turn out to be much worse — and it takes only one missed obligation to blow up a junk bond — often irreparably.
And, by the way, nobody really knows what the NAV of any of these funds is. The bonds seldom trade so daily pricing is estimated by outside services hired by portfolio managers. It’s only when you really need to get out of a position that you find out what the real price is — a price established when some other portfolio manager throws out a number in response to getting harangued by traders who keep hammering the buy side with lines like “Come on, everyone has a price. Tell me what it would take for you to pick up some of this stuff. . . please!” (When we want to speak in a. classy manner, we call this “price discovery.”)
Why Consider Any Junk (High Yield) Bond ETF
As noted above, when interest rates and yields round to zero or near zero as often as they do today, there are some messages investors are not going to receive no matter how loudly and advisor shouts. So at some point, it becomes a matter bowing to the notion that if somebody is going to get, let’s put it politely and say . . . aggressive, then one can at least try to be sensible-aggressive instead of are-you-kidding-aggressive.
Sensible Aggressive — Senior Loans
Senior loans are advance commitments of funds typically made to corporations by banks or similar financial institutions. These were exactly the sort of loans I wished I could have purchased back when I ran my mutual fund.
Portfolio average maturities for ETFs that invest in senior loans tend to be in the vicinity of five years. But duration, the much more important indicator of interest-rate risk, is very low, averaging about half a year. That’s because these are floating-rate loans. (A high coupon can reduce duration even on a longer-term maturity because duration factors in the ability of the lender to earn interest on interest, a consideration that becomes more prominent as coupon rise. A floating-rate coupon is as good as you can get in this respect.)
The real kicker, though, is the liquidation priority. In a worst-case scenario, all creditors are not equal. Some have a higher priority, which means no lender in a lower priority level could get a penny until those higher on the hierarchy get paid off. And some creditors even have security interests in physical corporate assets, much like a mortgage on your home. So if there was a need for restructuring, or a bankruptcy (and the creditors’ committee negotiations, that would be part of the process), the senior lenders, those at the top of the hierarchy, would be the ones leading the talks and whose interests would be best protected by any solution that emerged. Holders of the stuff owned by the typical junk-bond fund would be in the shut-up-and-take-what-we-give-you position.
High yield debt is always brutally risky and credit blowups (whether they lead to restructuring or full-on bankruptcy) are very painful 100% of the time. But if I’m going to get hit with one of these situations, I’d sure as heck prefer to be a senior secured lender rather than lower-than-dirt bondholder. (Are equity holders lower than bondholders? In theory yes, but in the real world, management holds equity and always finds a way to take care of itself in the restructuring. Exhibit A: Donald Trump, Exhibit B. Me, who was one of many bondholders burned on his casino debt).
Assessing Sensible Versus Are-You-Kidding
Two of the Senior Loan ETFs I found are ranked Neutral under our Power Rank ETF model, which is as good as it gets now in the high-yield area, where none are ranked Bullish or very Bullish. The third ETF has a Bearish rank.
Fixed Income is an area for which we base our ratings entirely on Technical Analysis due to the absence of US Equity constituents that are amenable to more fundamental modeling.
The high-yield fixed-income sample against which model testing can be done is much more limited, even than the already-small one I used last week to present the outstanding real-money-period results achieved by the model for the Global Thematic ETFs I discussed last week. It’s also noteworthy that for a primarily trend-oriented model such as we use, Global Thematic ETFs posed much less of a challenge than does fixed income, which most observers understand is at or near a generational turning point in what had, for a long time, been a fabulous trend. Even so, the model has, at least, been exceptional so far for US Fixed Income as a whole when it comes to spotlighting ETFs. to avoid.
Table 1: All US Fixed-Income ETFs
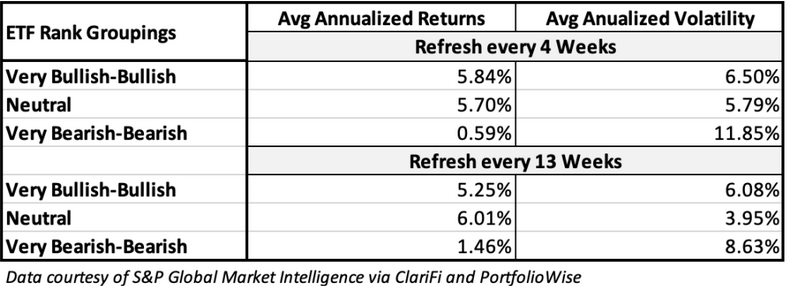
Table 2: All US Fixed-Income ETFs
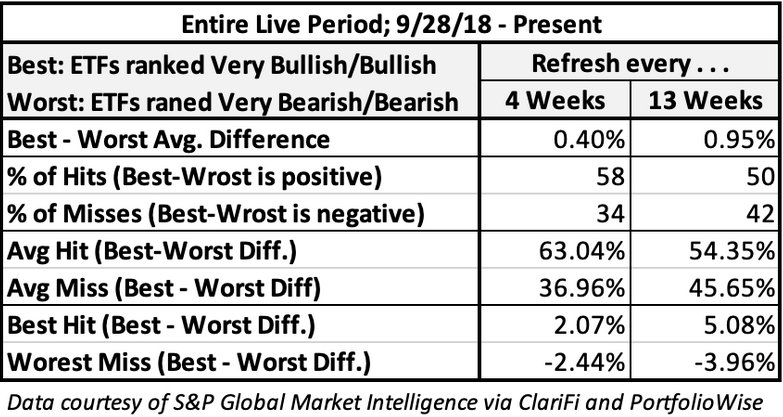
Table 3: All US Fixed-Income ETFs
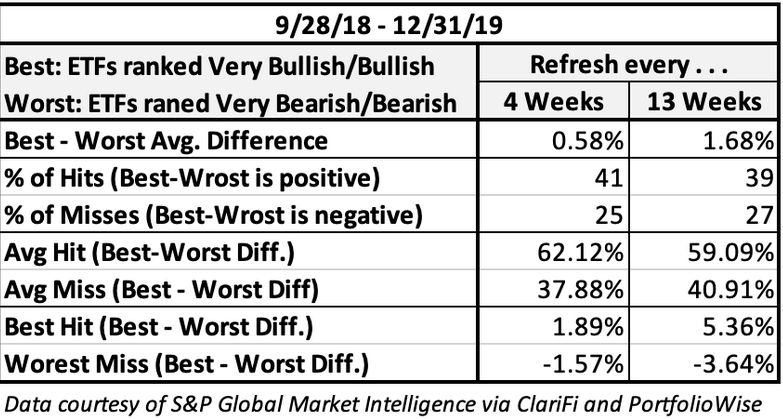
Despite the testing/measurement challenges, I suggest respecting the rank differentiation we see here given the recent magnitude of the suggested difference between Neutral Bearish/Very Bearish and the logic of the rank algorithm which should in and of itself motivate one to look into what might be causing Mr. Market (as our model interprets his message) to call out one of three seemingly similar ETFs.
The ETFs
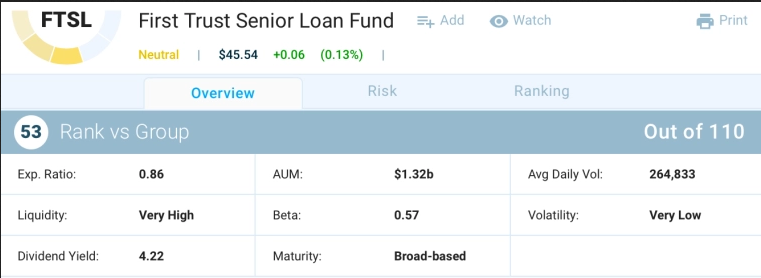
The neutrally ranked ETFs are First Trust Senior Loan Fund (NASDAQ:FTSL) and SPDR Blackstone GSO Senior Loan ETF (NYSE:SRLN)).
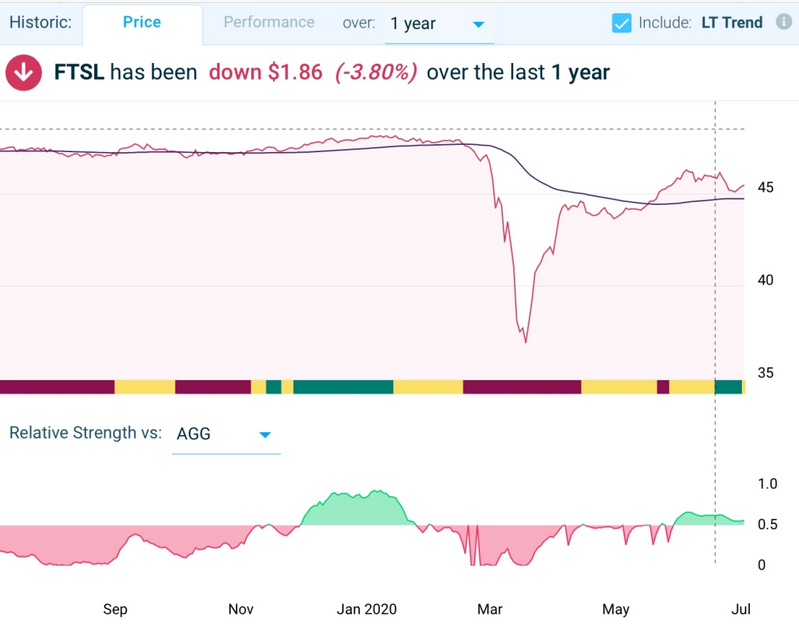
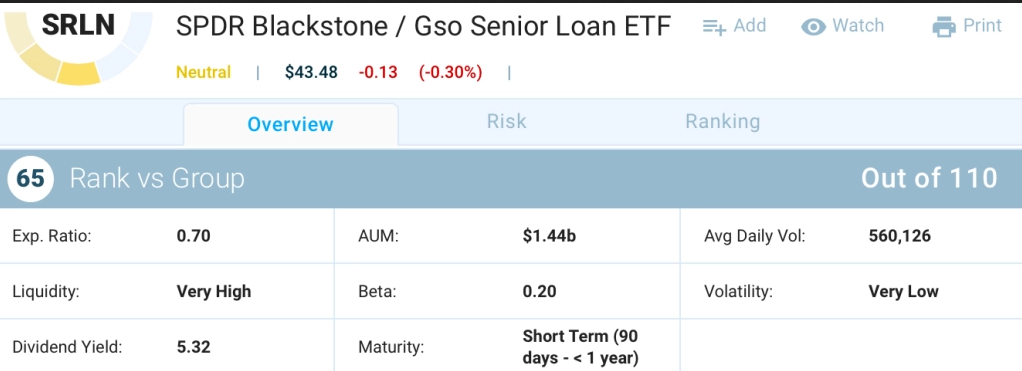
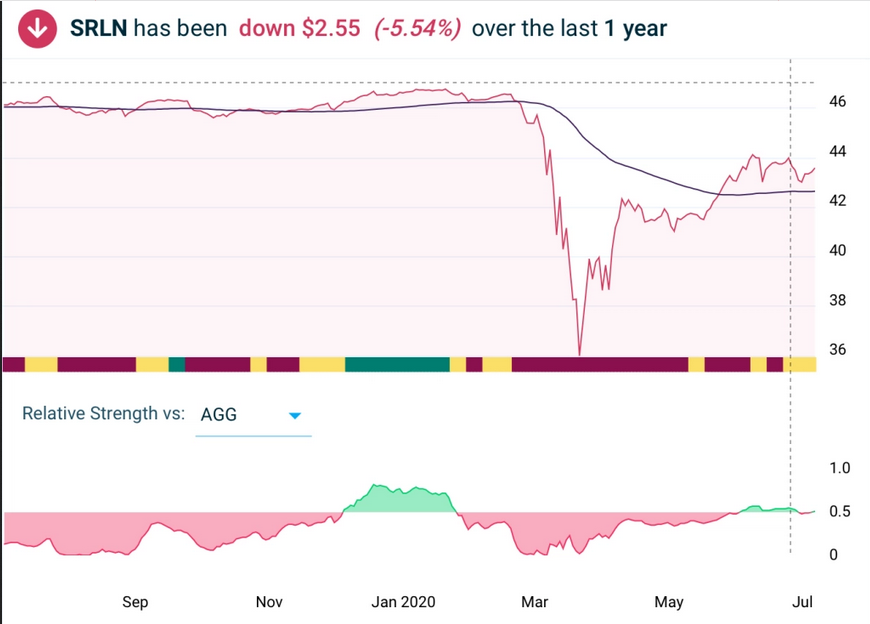
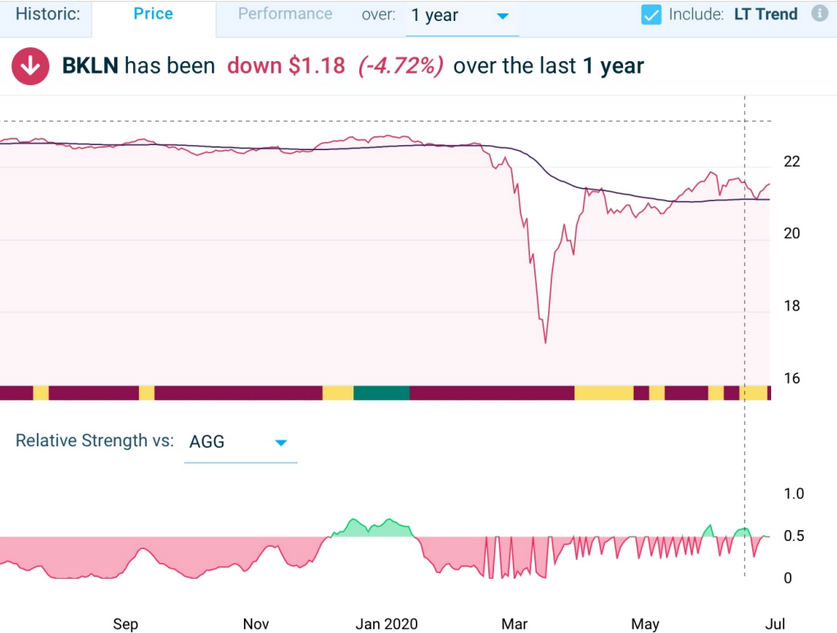
The Bearish ranked ETF is Invesco Senior Loan ETF (NYSE:BKLN)
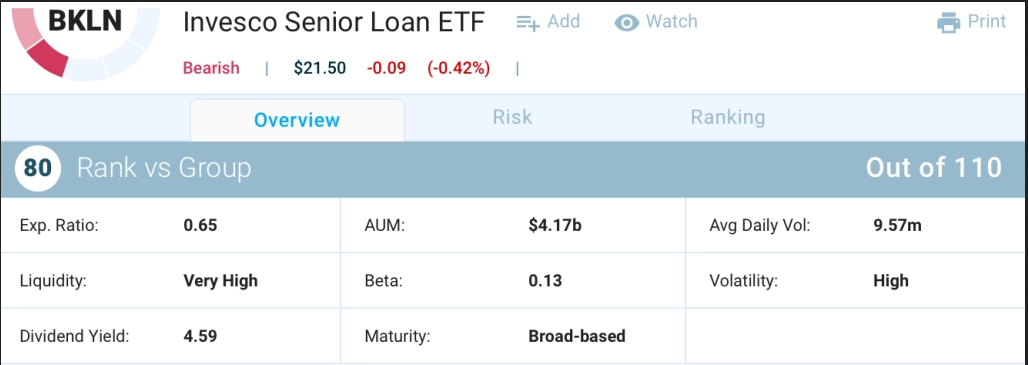
The foregoing images are courtesy of from PortfolioWise – Powered by S&P Global Market Intelligence/ClariFi
Comparing The ETFs
Although the yields presented differ, it’s important to remember that published ETF yields are necessarily soft numbers because portfolio holdings are continually maturing and being replaced by newly purchased positions in today’s market climate. But here, credit, rather than term, risk is the main concern. We’re not dealing with the sort of yield curve that would put new investments at a horrifying coupon disadvantage to many that are already in these not-especially-long-term portfolios anyway. Based on “SEC Monthly Yields,” which I’d say should be well representative of what investors are likely to realize, assume all three ETFs yield about 4.5%.
There are differences in liquidity and assets under management, but even the smallest readings here, for FTSL, are comfortably acceptable.
In terms of Beta — volatility relative to the movements of a benchmark which, in the case of fixed income, is the iShares U.S.Core Aggregate Bond ETF (NYSE:AGG), all the senior loan funds are low. That’s not surprising. Increased credit risk (suggesting greater relative volatility) has, in the market, been more than offset by the extremely low levels of interest-rate/term risk.
When it comes to volatility for each ETF in an absolute sense, we see a noticeable difference. BKLN, the Bearish ranked ETF is rated “Very High.”
I think the answer to what might be causing differences in Beta and Volatility, and in the message, Mr. Market has been delivering via the Power Rank, lies in the Prospectuses. FTSL and SRLN engage in issue-specific fundamental credit analysis (they don’t rely on the S&P, Moody’s, or Fitch credit ratings) as part of the security selection process. BKLN, on the other hand, does not appear to be doing this. The latter’s prospectus suggests it’s a plain-vanilla own-them-all indexer. When it comes to high-yield, I’m on board when it comes to anything an ETF provider does to move beyond the rating agencies and analyze securities on its own! And as far as BKLN goes, credit issues, being as idiosyncratic as they are from holding to holding, may well explain why BKLN’s volatility is tied, not to anything we see in the marketplace, but to ETF-specific matters.
The higher Beta for FTSL is interesting. It’s Prospectus specifically mentions its willingness to invest in “covenant-lite” instruments. These have fewer contractual requirements that obligate borrowers to achieve certain financial metrics that supposedly better shield them from default. I’ve never been a fan of covenants given how readily I’ve seen creditors restructure tough restrictions away in exchange for trivial increases in coupon interest payments. But that’s neither here nor there. If Mr. Market was bothered by this, it would be more likely apparent through the idiosyncratic Volatility metric rather than the market-based Beta statistic.
I suspect FTSL’s Beta has something to do with its higher expense ratio. I’m not necessarily a Vanguard groupie: I’m OK with higher fees for more customized products, and credit-analysis ETFs should cost more than generic buy-them-all offerings. My focus is on return to me in the stock market, and that is tied to ETF net asset values which are computed after fees and expenses have been subtracted. FTSL must achieve a higher portfolio-return hurdle in order to deliver comparable marketplace returns. That, I suspect, has something to do the higher relative-to-the-market Beta we’re seeing.
