
Singapore’s budget was presented by the country’s finance minister on Feb 19. The highlights were the plans of increasing GST and a one-time bonus “hongbao” for Singaporeans aged 21 and above.
Into the Headlines
Heng Swee Keat announced that GST will be increased 2% and will up to 9% sometime in the period 2021-2025 in order to increase government revenues. Heng expects to bring in this hike in the earlier phase of the period, as an early announcement will help people prepared better in order to handle the tax hike blow (read: ETFs in Focus as Singapore GDP Exceeds Expectations).
Per a Channel News Asia article, Heng said, “This GST increase is necessary because even after exploring various options to manage our future expenditures through prudent spending, saving and borrowing for infrastructure, there is still a gap, “adding “Increasing GST by two percentage points will provide us with revenue of almost 0.7 per cent of GDP per year. This boost will be vital in closing this gap.”
Singapore’s GDP grew 3.6% in 2017 compared with 2.4% in the prior year. This helped Singapore register a budget surplus of S$9.6 billion ($7.3 billion) in 2017, driving Singapore government’s decision to announce a one-off Singaporean bonus. Prime Minister Lee said in a Facebook (NASDAQ:FB) post, "Last year, we had a better-than-expected surplus," adding "Each Singaporean aged 21 and above [will] receive an SG Bonus of S$100 to S$300 depending on income, as we share the fruits of Singapore’s prosperity."
Moving on to the government’s aim of becoming cleaner and greener, a carbon tax of S$5 per ton of greenhouse gas emissions for companies producing 25,000 tons or more of greenhouse gases a year was announced in the budget, in order to encourage industries to reduce emissions. This rate is expected to be reviewed in 2023 and introduces an added expenditure for Singapore’s industries, while Heng expects to generate around S$1 billion ($760 million) in carbon tax in the first five years.
Risks to the City-State
All in all, Singapore’s economy is on a strong growth trajectory. Being largely trade dependent, improvement in manufacturing sector significantly contributed to GDP growth. On a year-over-year basis, the manufacturing sector grew 10.1% in 2017 compared with 3.7% in the prior year.
Although the global exports boom has benefited the city state, rising protectionism across the world might weigh on the trade outlook. Moreover, faster-than-expected rate increases by the Federal Reserve might prompt the Monetary Authority of Singapore (MAS) to change monetary policy.
In a report on Monday, Standard Chartered Bank stated that it expects the central bank to raise the Singapore dollar nominal effective exchange rate policy band by 50 basis points in April, despite the proposed GST hike.
We will now discuss a few ETFs providing exposure to Singapore (see all the Asia Pacific ETFs here).
IShares MSCI Singapore Capped ETF (V:EWS)
This fund focuses on Singapore equities and is the most popular option for exposure to the economy.
The fund has AUM of $695.4 million and charges 49 basis points in fees per year. Financials, Industrials and Real Estate are the top three sectors of the fund, with 43.4%, 19.1% and 16.8% allocation, respectively (as of Feb 20, 2018). DBS Group Holdings Ltd, Oversea-Chinese Banking Ltd and United Overseas Bank Ltd are the top three holdings of the fund, with 17.0%, 12.7% and 11.2% allocation, respectively (as of Feb 21, 2018). The fund has returned 20.6% in a year. EWS has a Zacks ETF Rank 3 (Hold), with a Low risk outlook.
We will now compare the performance of EWS to a broader South East Asian ETF, ASEA.
Global X Southeast Asia ETF ASEA
This fund provides broad exposure to the five members of the Association of Southeast Asian Nations, namely, Singapore, Indonesia, Malaysia, Thailand and the Philippines. It is appropriate for investors looking for diversified exposure to South East Asia.
ASEA is less popular with AUM of $20.3 million and charges a fee of 65 basis points a year. From a geographical perspective, the fund has 30.7% exposure to Singapore, 22.3% to Thailand, 21.4% to Malaysia, 19.1% to Indonesia and 6.5% to the Philippines (as of Dec 31, 2017). Financials, Telecommunication Services and Consumer Staples are the top three sectors of the fund, with a 47.9%, 13.7% and 7.9% allocation, respectively (as of Dec 31, 2017). DBS Group Holdings Ltd, Oversea-Chinese Banking Ltd and United Overseas Bank Ltd are the top three holdings of the fund, with an allocation of 9.0%, 7.5% and 6.1%, respectively (as of Feb 22, 2018). The fund has returned 32.6% in a year. ASEA has a Zacks ETF Rank #3, with a Medium risk outlook.
Below is a chart comparing the one-year performance of the two funds.
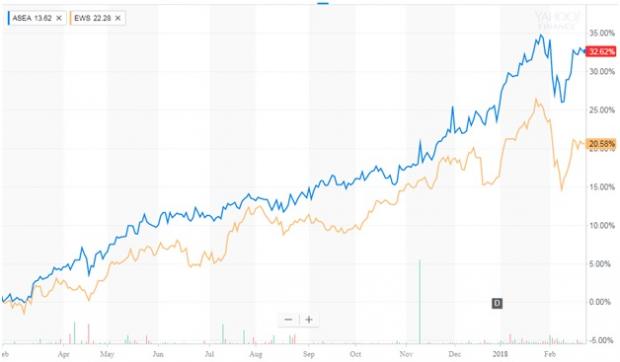
Source: Yahoo (NASDAQ:AABA) Finance
Want key ETF info delivered straight to your inbox?
Zacks’ free Fund Newsletter will brief you on top news and analysis, as well as top-performing ETFs, each week. Get it free >>
ISHRS-MS SNGPRE (EWS): ETF Research Reports
GLBL-X SE ASIA (ASEA): ETF Research Reports
Original post
Zacks Investment Research