While the major stock market indexes have suffered recently, mostly due to concerns about a global trade war, one exchange-traded fund (ETF) has quietly been on a tear: the Utilities Select Sector SPDR Fund XLU). In fact, XLU just wrapped up an eighth straight win on Wednesday, marking its longest win streak since July 2016, and retook a major moving average. Further, the ETF's rally could have legs, if history is any indicator.
XLU Signal Not Sounded Since 2009
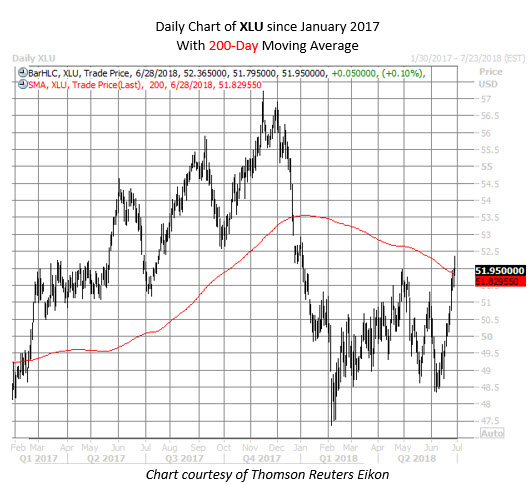
Since carving out a near-term bottom of $48.37 earlier this month, XLU shares have rallied roughly 7.4%, and recently closed above their 200-day moving average for the first time in 2018. It marks only the third time ever that XLU remained below this trendline for more than six months. The last time the ETF crossed above the 200-day after six or more months was in June 2009, just after the March 2009 bottom. Prior to that, you'd have to go back to April 2003, per data from Schaeffer's Senior Quantitative Analyst Rocky White. The fund was last seen up 0.1% at $51.95, set for a ninth consecutive gain.


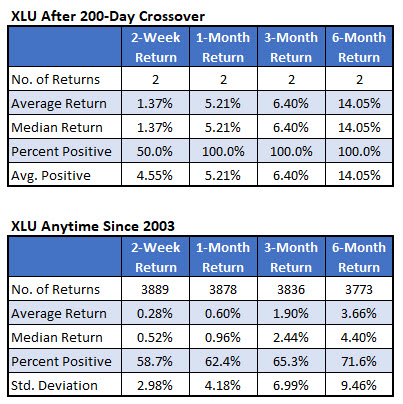
While the sample size is small, it's encouraging that XLU went on to outperform after retaking its 200-day moving average following six months beneath this trendline. In fact, the fund was higher 100% of the time one, three, and six months later.
More specifically, one month later, the ETF was up 5.21%, on average, compared to an average anytime gain of 0.6%, looking at data since 2003. Three months later, XLU was up 6.4% -- more than three times its average anytime gain of 1.9%. Six months after a bullish cross of its 200-day, the utilities ETF was up a whopping 14.05%, on average -- nearly four times the norm.

XLU on Hottest Streak in 2 Years
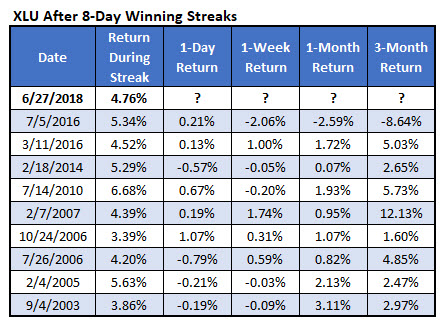
As alluded to earlier, XLU just notched its longest win streak in nearly two years. Since 2003, the fund has enjoyed a streak of this magnitude just 10 times. There have been only five nine-day winning streaks for the ETF, the last also occurring around the start of the third quarter in 2016.

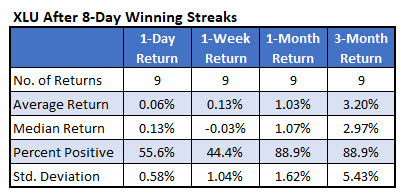
In the past, eight-day win streaks have preceded some stronger-than-usual price action for XLU. One month after a streak, the fund was up 1.03%, on average, and higher 88.9% of the time. That's compared to an average anytime one-month gain of 0.6%, with a win rate of 62.4%. Three months out, the ETF was up 3.2%, on average, and up 88.9% of the time -- again, outperforming its anytime three-month returns.

In conclusion, if history is any indicator, the Utilities Select Sector SPDR Fund is flashing a pair of bullish signals. Previous eight-day win streaks have preceded stronger-than-usual average returns for the shares, and the recent retake of the 200-day moving average after so long could have even bigger implications. Traders looking to speculate on XLU's short-term trajectory can pick up options at a relative discount, too. The ETF's Schaeffer's Volatility Index (SVI) of 13% is in just the 12th percentile of its annual range, suggesting near-term XLU options are pricing in relatively low volatility expectations right now.
