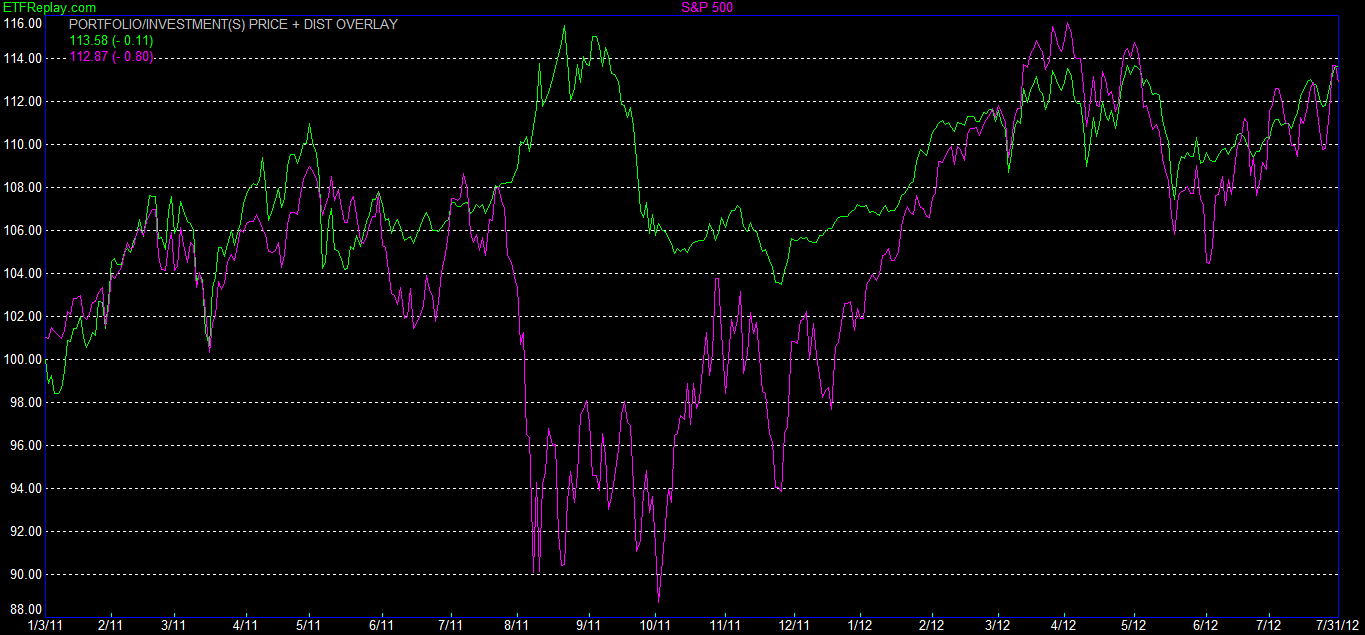
I track this strategy as a public portfolio on Scott’s Investments. As of the close July 31st the hypothetical portfolio was up 13.60%, since inception on January 1st, 2011. Returns include dividends but exclude commissions and taxes and all trades are hypothetical so real results will differ. For some backtests on these strategies please see a recent post here.
For July 31st the strategy sold its positions in Vanguard MSCI U.S. REIT (VNQ) for a gain of 2%. The proceeds were used to purchase iShares Barclays Long-Term Treasury (TLT). The portfolio also continues to hold iShares iBoxx Invest Grade Bond (LQD), PowerShares Emerging Mkts Bond (PCY) and U.S. Utilities Sector SPDR (XLU).
The purchase of TLT for this month is noteworthy – long-term interest rates in the United States are near historic lows. More than one market pundit has called for a “bottom” in interest rates since 2008/2009. Holding long-term bonds over the long-term is a scary proposition – rates are bound to increase someday which would cause the value of TLT to drop. However, keep in mind that this strategy is rules-based and rotates between several different asset classes on a monthly basis. Also, when everyone and their grandmother sees a trade as a slam-dunk (in this case shorting bonds), the market will surely take its time in cooperating.
Minor fluctuations in rankings may not always justify selling positions each month. For example, if one ETF drops from the second highest rated to the third or fourth highest rated, it may not warrant selling the position. An investor could only sell a position when it drops out of the top 4 or 5 at the end of the month. This type of modification could be used when someone is looking to limit turnover; however, I think it is important to have whatever rule you prefer to use in place prior to making the investment decision in order to avoid discretionary or emotional decision making.
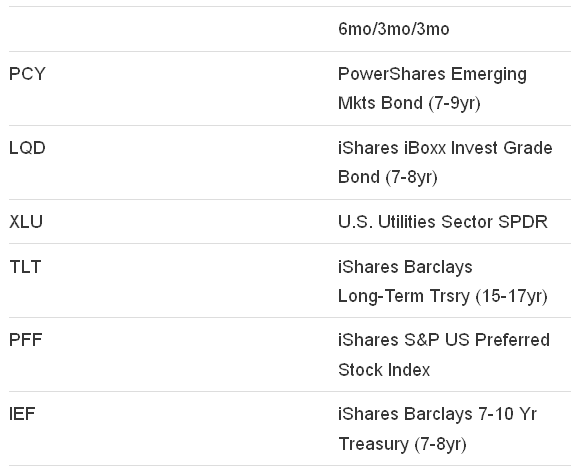
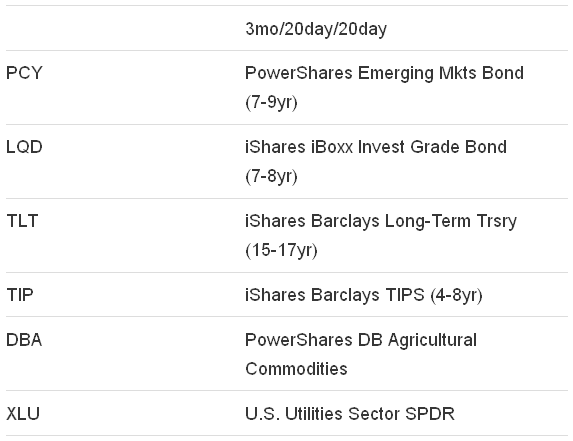
Below are the top 6 ranked ETFs for this month, using both the 6/3/3 and 3/20/20 strategy:


Below is a performance graph of the portfolio (green) versus SPY (SPDR S&P 500 ETF) in purple from the portfolio’s inception until July 31st, 2012. Total returns are similar but a significant drawdown was avoided in 2011:
- English (UK)
- English (India)
- English (Canada)
- English (Australia)
- English (South Africa)
- English (Philippines)
- English (Nigeria)
- Deutsch
- Español (España)
- Español (México)
- Français
- Italiano
- Nederlands
- Português (Portugal)
- Polski
- Português (Brasil)
- Русский
- Türkçe
- العربية
- Ελληνικά
- Svenska
- Suomi
- עברית
- 日本語
- 한국어
- 简体中文
- 繁體中文
- Bahasa Indonesia
- Bahasa Melayu
- ไทย
- Tiếng Việt
- हिंदी
ETF Replay Portfolio For August
The buy/sell strategy for the portfolio is simple: purchase the top ETFs based on a combination of their 6 month returns, 3 month returns, and 3 month volatility (lower volatility receives a higher ranking) and the average of the 3 month return, 20 day return, and 20 day volatility. I refer to these two different sets as “6/3/3″ and “3/20/20″. The top 2 ETFs in the 6/3/3 ranking and top 2 in the 3/20/20 ranking are purchased each month. When there are duplicates in the top 2, I look to the third ranked ETF in the 3/20/20 and, if necessary, the third ranked ETF in the 6/3/3. The strategy always holds 4 ETFs.
Latest comments
Loading next article…
Install Our App
Risk Disclosure: Trading in financial instruments and/or cryptocurrencies involves high risks including the risk of losing some, or all, of your investment amount, and may not be suitable for all investors. Prices of cryptocurrencies are extremely volatile and may be affected by external factors such as financial, regulatory or political events. Trading on margin increases the financial risks.
Before deciding to trade in financial instrument or cryptocurrencies you should be fully informed of the risks and costs associated with trading the financial markets, carefully consider your investment objectives, level of experience, and risk appetite, and seek professional advice where needed.
Fusion Media would like to remind you that the data contained in this website is not necessarily real-time nor accurate. The data and prices on the website are not necessarily provided by any market or exchange, but may be provided by market makers, and so prices may not be accurate and may differ from the actual price at any given market, meaning prices are indicative and not appropriate for trading purposes. Fusion Media and any provider of the data contained in this website will not accept liability for any loss or damage as a result of your trading, or your reliance on the information contained within this website.
It is prohibited to use, store, reproduce, display, modify, transmit or distribute the data contained in this website without the explicit prior written permission of Fusion Media and/or the data provider. All intellectual property rights are reserved by the providers and/or the exchange providing the data contained in this website.
Fusion Media may be compensated by the advertisers that appear on the website, based on your interaction with the advertisements or advertisers.
© 2007-2025 - Fusion Media Limited. All Rights Reserved.
