US Real Estate Shares Led Global Markets
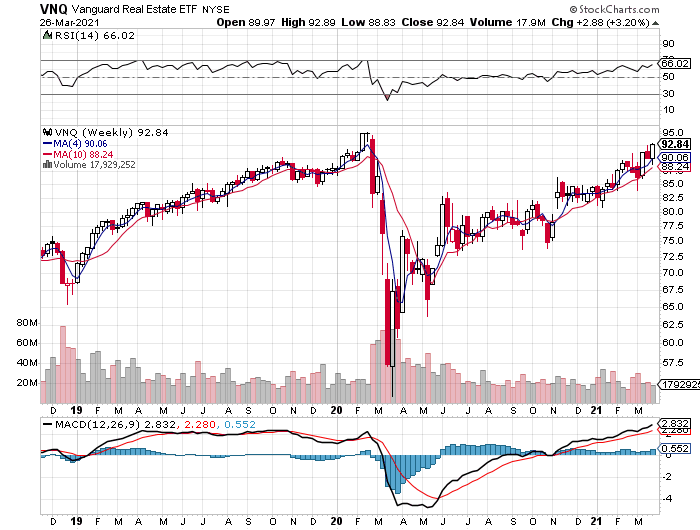
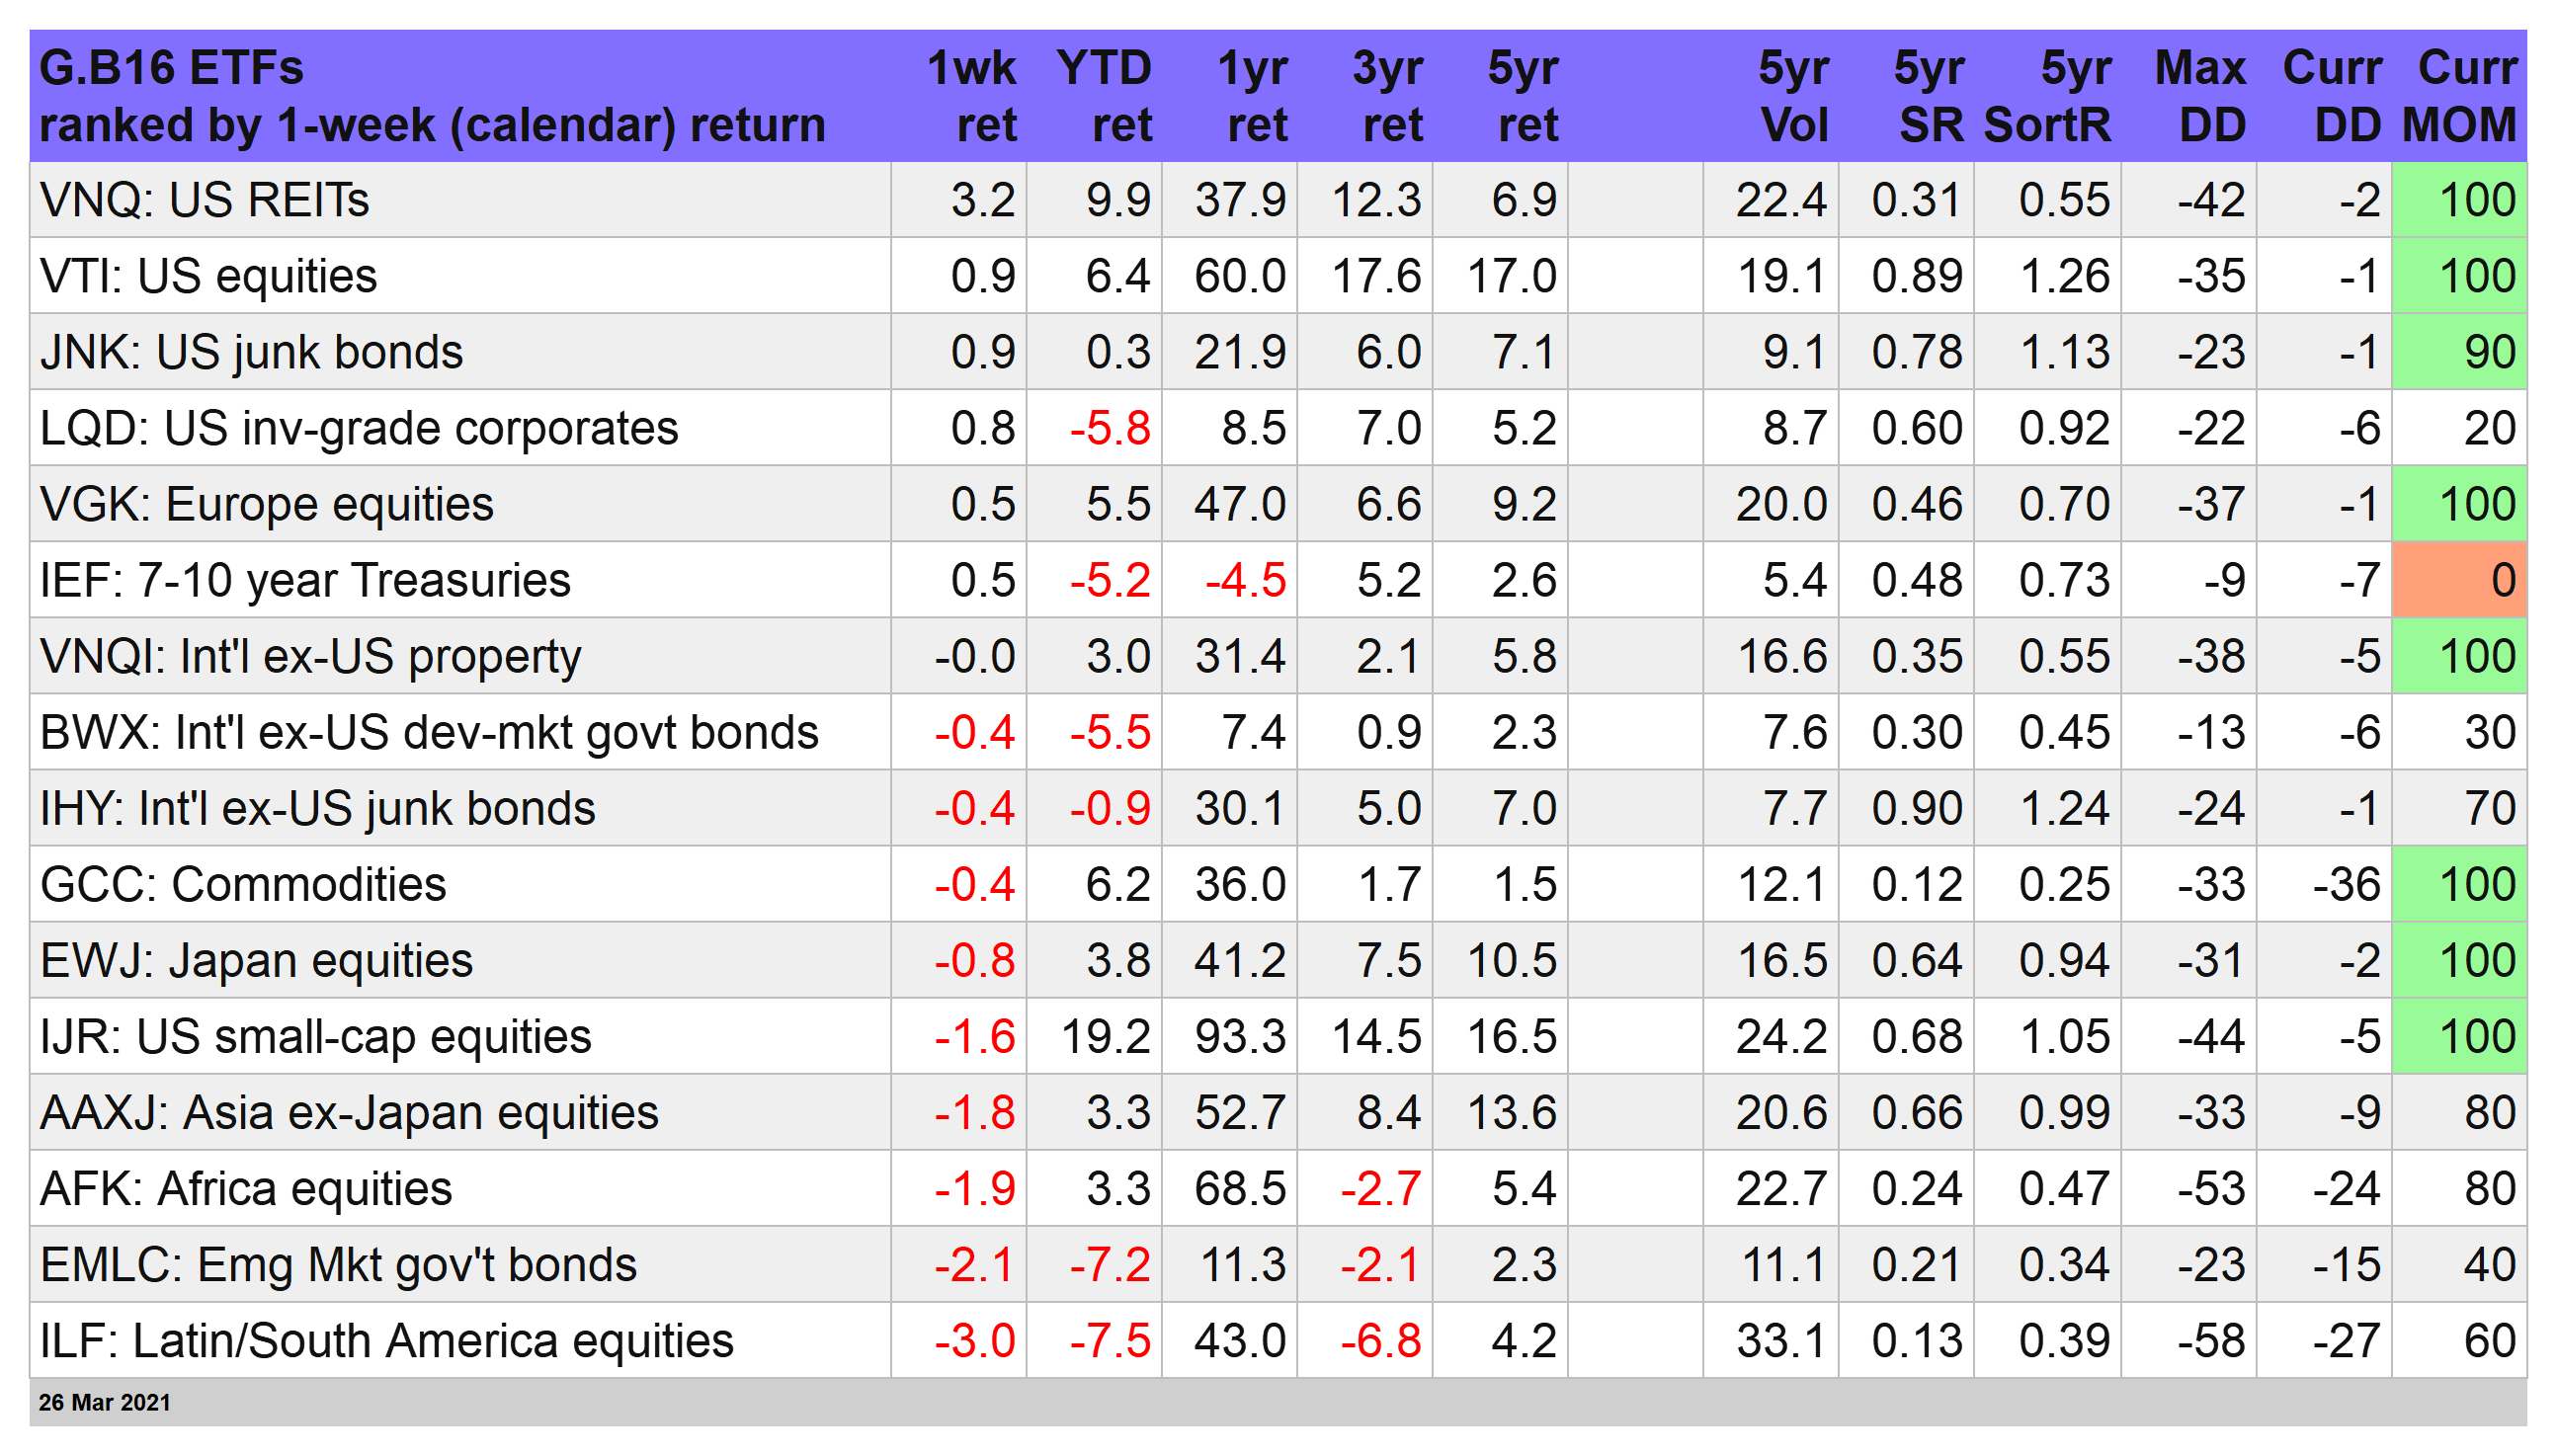
The rebound in real estate investment trusts (REITs) was alive and well. Vanguard Real Estate Index Fund ETF Shares (NYSE:VNQ) was still below its pre-pandemic peak, but last week’s 3.2% pop (through Mar. 26) puts the ETF within shouting distance of its February 2020 record high.
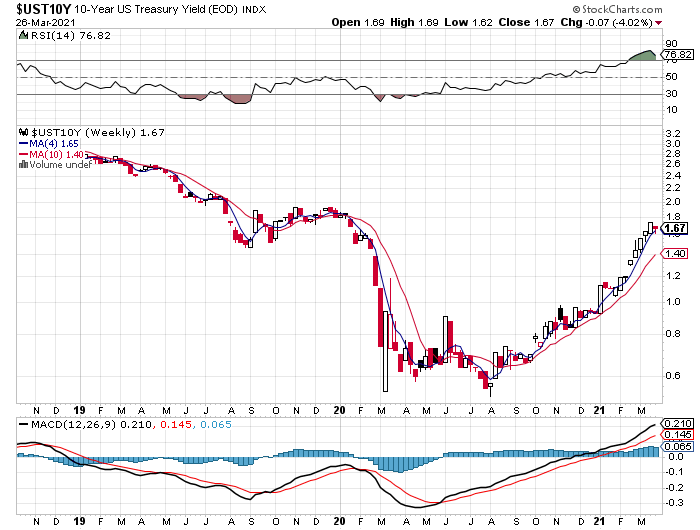
The drop in interest rates didn’t hurt. As a yield sensitive market, REITs were losing some of their edge vs. bonds this year as Treasury rates rose. But for the first time in over two months the benchmark 10-year yield retreated on a weekly basis, settling at 1.67%.
One weekly decline could be noise, of course, so all eyes will stay focused on the bond market this week to see if there’s a follow-through. But for the moment, traders are wondering if the bond market rout of 2021 is over or merely on a brief hiatus.
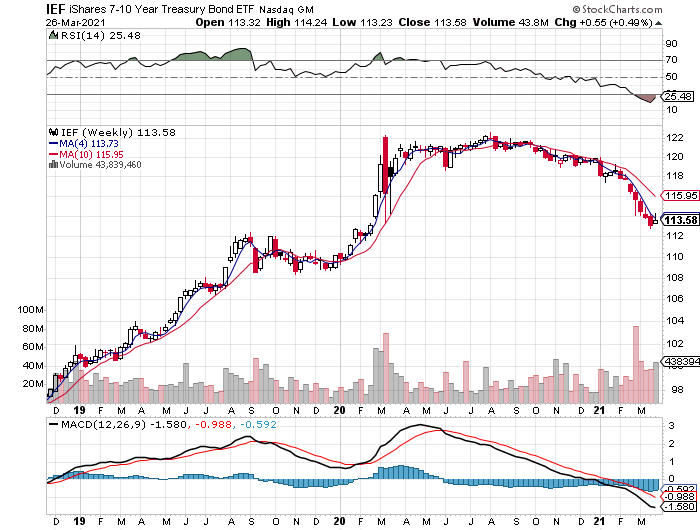
For last week, at least, Treasuries achieved a rare feat: posting a weekly gain this year. The iShares 7-10 Year Treasury Bond (NYSE:IEF) edged up 0.5%. The weekly advance barely makes a dent after seven straight weekly declines, but it’s a start. Betting that there’s more to come still looks like a long shot, based on strong downside trend. But perhaps Mr. Market has more surprises in store for the bond market.
Stocks overall had a mixed week, with US—Vanguard Total Stock Market Index Fund ETF Shares (NYSE:VTI) and Europe—Vanguard FTSE Europe Index Fund ETF Shares (NYSE:VGK) posting solid gains.
Asia—iShares MSCI All Country Asia ex Japan ETF (NASDAQ:AAXJ and iShares MSCI Japan ETF (NYSE:EWJ), Africa and Latin America, by contrast, felt the weight of gravity. Ditto for US Shares Core S&P Small-Cap ETF (NYSE:IJR), which continued to reverse for a second week, although the 1.6% decline still leaves this slice of US shares with a sizzling 19.2% year-to-date rally.
Solid Gains For Portfolio Strategy Benchmarks
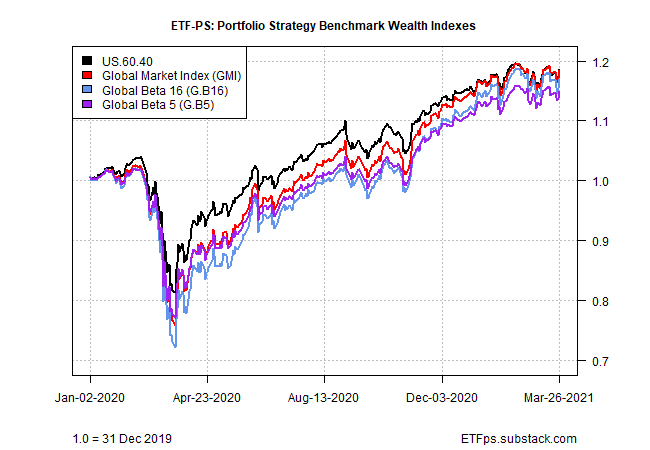
Although global markets delivered mixed results last week, all four of our strategy benchmarks gained ground following the previous week’s across-the-board declines.

The US stocks/bonds-60/40 mix led the way with a strong 0.7% weekly increase. For the first time since January, both sides of this asset allocation were in positive terrain.
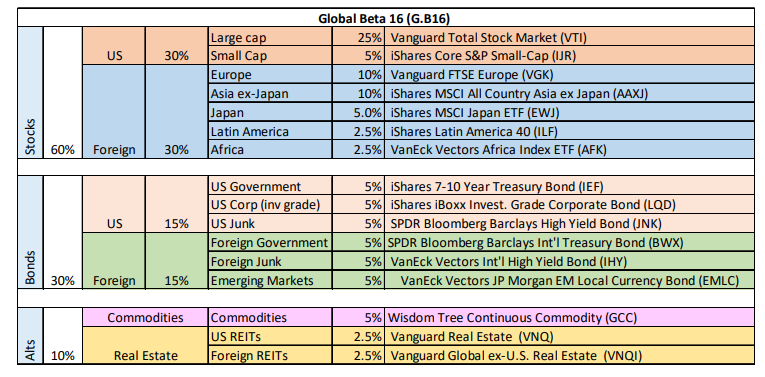
Our standard 16-fund opportunity set that powers the Global Beta 16 index (G.B16) clawed back a small portion of the previous week’s loss. The 0.1% increase was a weak rebound, but on a year-to-date basis G.B16 is holding on to a modest lead over the other three benchmarks.
Despite the positive trends this year, the portfolio benchmarks have been stuck in a range over the past month or so. Nothing goes up in a straight line, of course, and so this could be a run of healthy consolidation. Unless it’s not and the long-running up trend is running out of steam.
A key question for the weeks ahead: Will interest rates continue to rise? Or is last week’s pullback in rates a sign that the reflation trade is over? The answer will have a non-trivial influence on our strategy benchmarks and whether they’re set to break above their recent highs in the near future or continue to churn in a range.
