Headline unemployment has fallen to a 5-year low of 7%. The perception that job growth is strengthening may pressure the Federal Reserve to curb its program of electronically printing money ($85 billion per month) and, subsequently, purchasing U.S. bonds. Buying government debt in various amounts since late in 2008 has had the desired effect of pushing intermediate-term bond prices higher and interest rates lower. On the flip side, curtailing the purchases in any substantive way would depress bond prices dramatically and send interest rates skyrocketing.
The Rub
Here’s the challenge in a pistachio nut shell. Money managers have been cutting back their allocation to U.S. treasuries. U.S. retail investors have been pulling back on their bond fund holdings. Central banks around the world pared their exposure by $128 billion between April and August. Heck, CNBC is talking up the potential virtues of shorting the bond market. It follows that any significant pull back by the Federal Reserve could cause a yield spike not unlike the one that occurred in the May-June period. Only this time, a dramatic jump in the cost of borrowing for consumers might not just dent the real estate revival and economic recovery at large, it could kill both.
No Easing Till Late 2014
Very few analysts agreed with me that it was unlikely for the Federal Reserve to do anything of substance in September. As it turned out, they did not take any action. And in spite of those who will talk about Fed moves in December or January, I will say it again: The Fed will not make significant changes to its policy of quantitative easing until the second half of 2014 at the earliest. Might they make a trivial gesture of slowing the monthly activity from $85 billion to $75 billion? Sure. Yet anything that resembles a genuine directional shift could create a stampede for the exits; anything more than a Fed “nod-and-a-wink” could choke off economic recovery entirely.
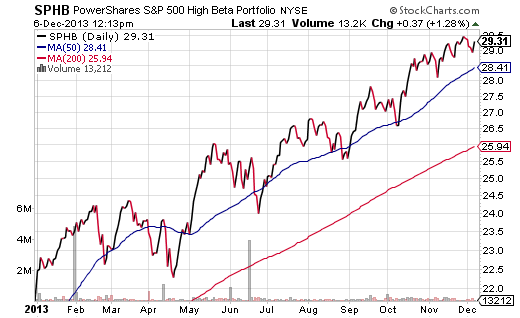
The question for ETF enthusiasts is how to invest in the year ahead. Some may be tempted to get remarkably aggressive with high beta, in light of the general uptrend in stocks and in light of the unflattering alternatives in the income arena. For those who have a solid sell discipline, PowerShares S&P 500 High Beta (SPHB) is well above its 50-day and 200-day trendlines.
On the other hand, what if you do not like the feeling associated with volatile price movements in your individual holdings? What if you want to participate in stock strength, but prefer a little less speculation and a little more safe harboring?
Low Volatility ETFs
Exchange-traded fund providers endeavored to fill the safer-stock niche with the creation of “Low Vol,” or Low Volatility ETFs. The top 5 funds in this space already command close to $11 billion in assets. The concern that I have, however, is whether or not the traditional notion of what constitutes low volatility can serve a safer harboring role should interest rates rise rapidly.
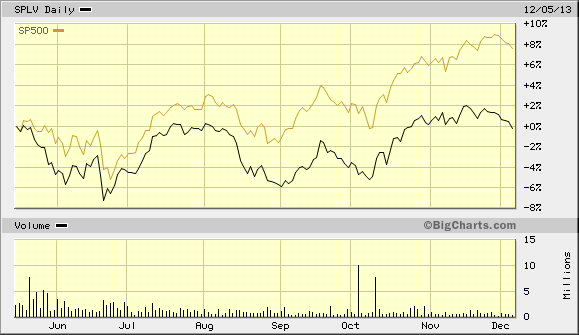
Let’s consider the type of stocks that, historically speaking, are less volatile. These are often the types of companies that have appealed to grandma and grandpa — utility companies, staples, high dividend income producers. Indeed, PowerShares S&P 500 Low Volatility (SPLV) has roughly 25% in utility stock, 20% in consumer staples and a 30-day SEC yield that of 2.55% that far exceeds the S&P 500 yield of 1.85%.
The problem with the allocation is the fact that utility companies as well as high yielding dividend income assets are proving to be plenty volatile in a rising rate environment. Since the Federal Reserve first announced its openness to tapering “QE” back in mid-May, SPLV has moved sideways on price movement and it has been equally volatile as the S&P 500. Yet the S&P 500 has gained another 8% in the time period; SPLV’s total return of roughly 1% is attributable largely to the income distribution.
Spread Exposure
The iShares MSCI USA Minimum Volatility Fund (USMV) is a better alternative at the current moment. The reason? Its exposure is spread across many different segments, including health care, financials, technology, staples and utilities. The fund still has rate sensitivity due to the greater-than-normal SEC dividend yield of 2.5%, though. In the same time frame that SPLV’s total return was 1%, USMV’s was approximately 3%.
Nevertheless, an investor in USMV should expect a greater chunk of the S&P 500’s upside than what we’ve seen thus far. If the Fed manages to contain interest rates, particularly the 10-year yield in the 2.75%-3.25% arena, USMV’s performance would capture far more of the S&P 500’s upside. A spike in the 10-year to 3.75%? Forget about it.
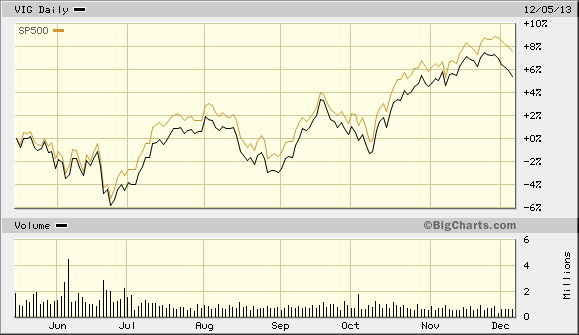
I prefer USMV to SPLV for the reasons mentioned above. That said, I think that a “safer” stock alternative in a rising rate environment is Vanguard Dividend Growth (VIG). Rather than focusing solely on corporations with higher-than-average yields, dividend growers that raise the cash they return to investors tend to appreciate in price nicely. They also tend to represent less volatile corporations. In fact, from my vantage point, as long as a general stock market uptrend remains intact, one of the savviest risk-reward stock ETFs continues to be Vanguard Dividend Growth (VIG).


