ETF Flyover: DIA, DXJ, GDX, HDGE, UUP And Oil

Published 01/08/2018, 12:35 AM
Updated 07/09/2023, 06:31 AM
USD/JPY
-
XAU/USD
-
DJI
-
DIA
-
DX
-
GC
-
CL
-
UUP
-
GDX
-
GDXJ
-
DXJ
-
HDGE
-

I am composing over flyover country, hence the title. Anyway, to wrap the weekend up, I thought we could look at a few ETFs. First off, here’s the Dow (SPDR Dow Jones Industrial Average (NYSE:DIA)) diamonds. As the inset shows, decade-long trendlines have been pushed aside. We’re in la-la land now, folks; the undiscovered country. Call it what you like, but new highs are a beast to assess, because they tend to feed off themselves until…………they don’t.
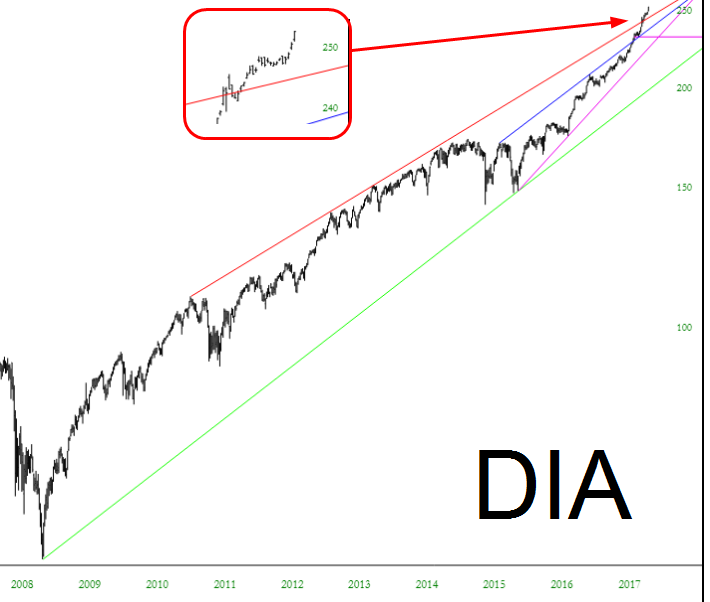
DIA Chart

And just to prove trillions of dollars (or quadrillions of yen) don’t matter, look no farther than Japan via WisdomTree Japan Hedged Equity (NYSE:DXJ). Jim Cramer never looked so smart. Buy, buy, buy!
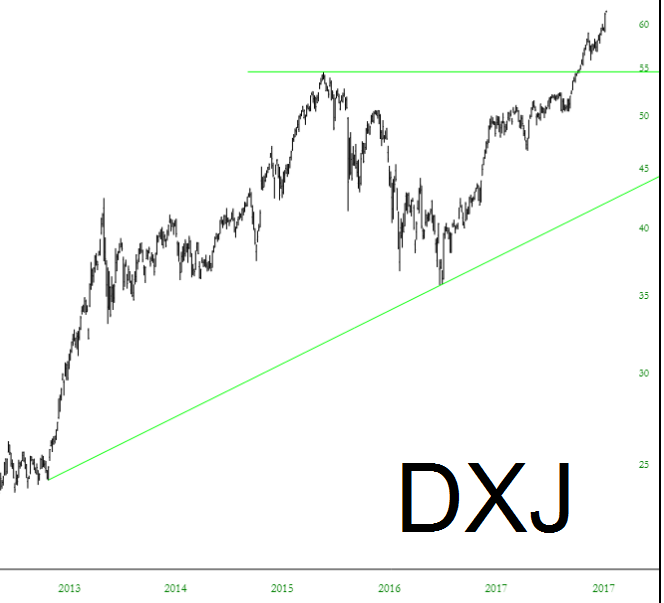
DXJ Chart

Away from equities, charts get a little more interesting. Gold, miners via VanEck Vectors Gold Miners (NYSE:GDX), and junior miners (VanEck Vectors Junior Gold Miners (NYSE:GDXJ)) all have the same challenge: to push past the descending red trendline that’s hemmed it in since September 2011. I’ve got to say, it’s getting closer. Maybe this will be the week they finally do it, but it’s going to take a weak dollar to make it so.
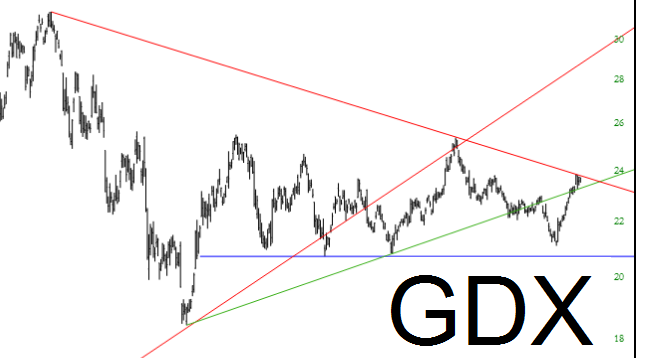
GDX Chart

And in case you didn’t get the memo, the market has been a living hell for bears for going on nine years now. Just look at the Ranger Equity Bear fund (NYSE:HDGE).
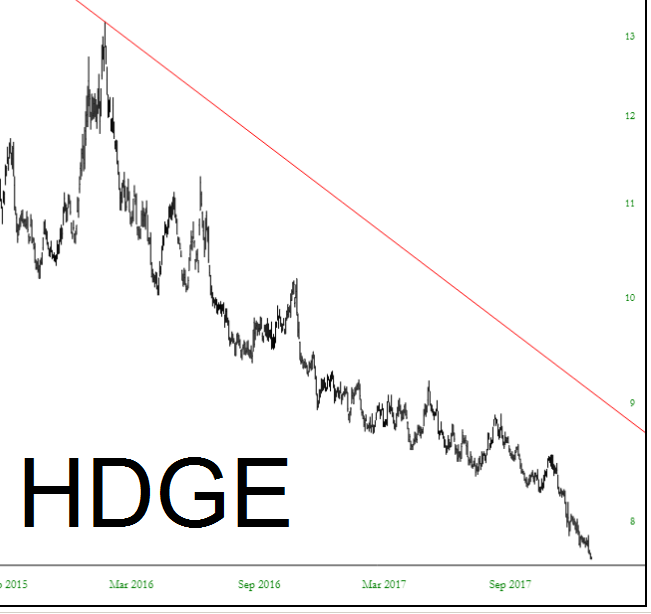
HDGE Chart

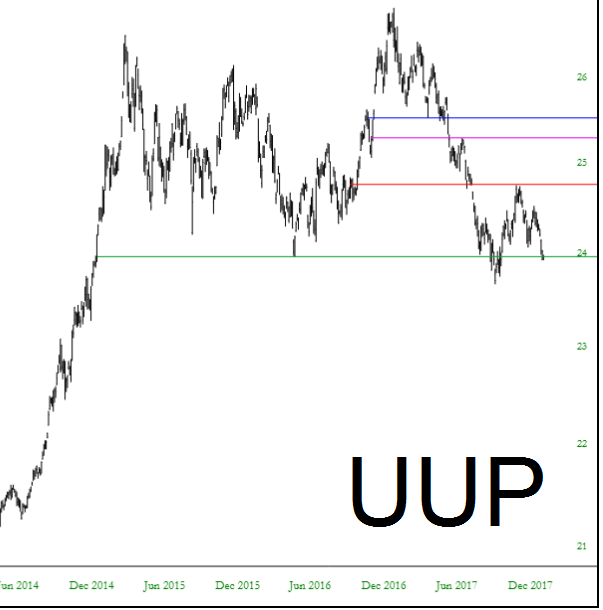
I mentioned earlier how the dollar had to break to give the gold bugs a break. The dollar via PowerShares DB US Dollar Bullish (NYSE:UUP) is resting on a precipice. This has been the low point for the past few years, and a failure at this support could really give the gold bugs a needed break.
UUP Chart

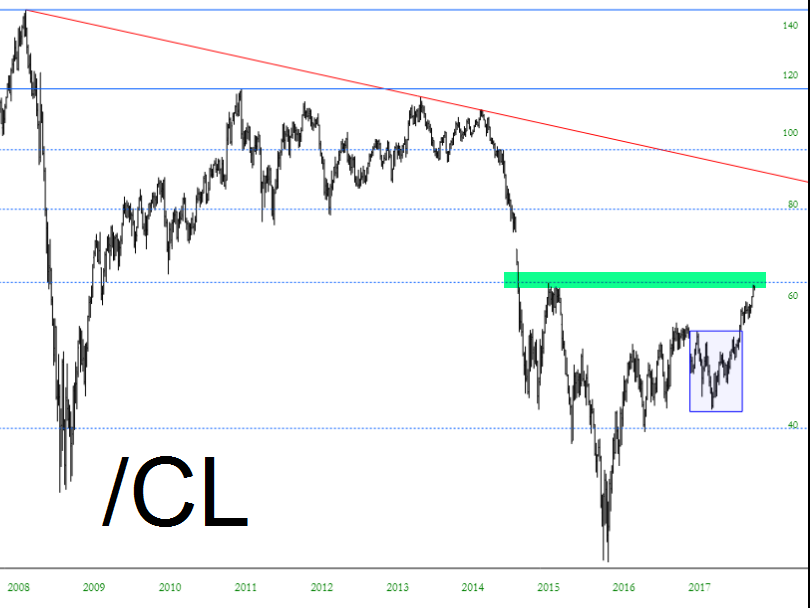
Lastly, here’s the long-term continuous contract for crude oil. It is butted up against its Fibonacci resistance, which has likewise been a high point for the past several years. My view is that it’s going to weaken soon and, at most, would finish its rally at about $67. However, I’m not sure it’s even going to get that far.
CL Chart

Latest comments

Loading next article…
Risk Disclosure: Trading in financial instruments and/or cryptocurrencies involves high risks including the risk of losing some, or all, of your investment amount, and may not be suitable for all investors. Prices of cryptocurrencies are extremely volatile and may be affected by external factors such as financial, regulatory or political events. Trading on margin increases the financial risks.
Before deciding to trade in financial instrument or cryptocurrencies you should be fully informed of the risks and costs associated with trading the financial markets, carefully consider your investment objectives, level of experience, and risk appetite, and seek professional advice where needed.
Fusion Media would like to remind you that the data contained in this website is not necessarily real-time nor accurate. The data and prices on the website are not necessarily provided by any market or exchange, but may be provided by market makers, and so prices may not be accurate and may differ from the actual price at any given market, meaning prices are indicative and not appropriate for trading purposes. Fusion Media and any provider of the data contained in this website will not accept liability for any loss or damage as a result of your trading, or your reliance on the information contained within this website.
It is prohibited to use, store, reproduce, display, modify, transmit or distribute the data contained in this website without the explicit prior written permission of Fusion Media and/or the data provider. All intellectual property rights are reserved by the providers and/or the exchange providing the data contained in this website.
Fusion Media may be compensated by the advertisers that appear on the website, based on your interaction with the advertisements or advertisers.
© 2007-2025 - Fusion Media Limited. All Rights Reserved.