ES_F Batter Up

Published 04/04/2017, 01:07 AM
Updated 05/14/2017, 06:45 AM

ES_F has a harmonic pattern Bat emerging on both the Day and intraday charts.

Day chart shows where price can brk & hold outside Friday’s range offers clue for initial directional bias. Above 2366.75 implies price still forming the third of four legs for this pattern with 2398 as the extreme for this scenario. Below 2356.75 increases the probability of testing first the green GRZ (Golden Ratio Zone aka the 38.2% to 61.8% fibs), this is a nice gauge region because below there highly increases the probabilty of completing the Bat at 2265.75.
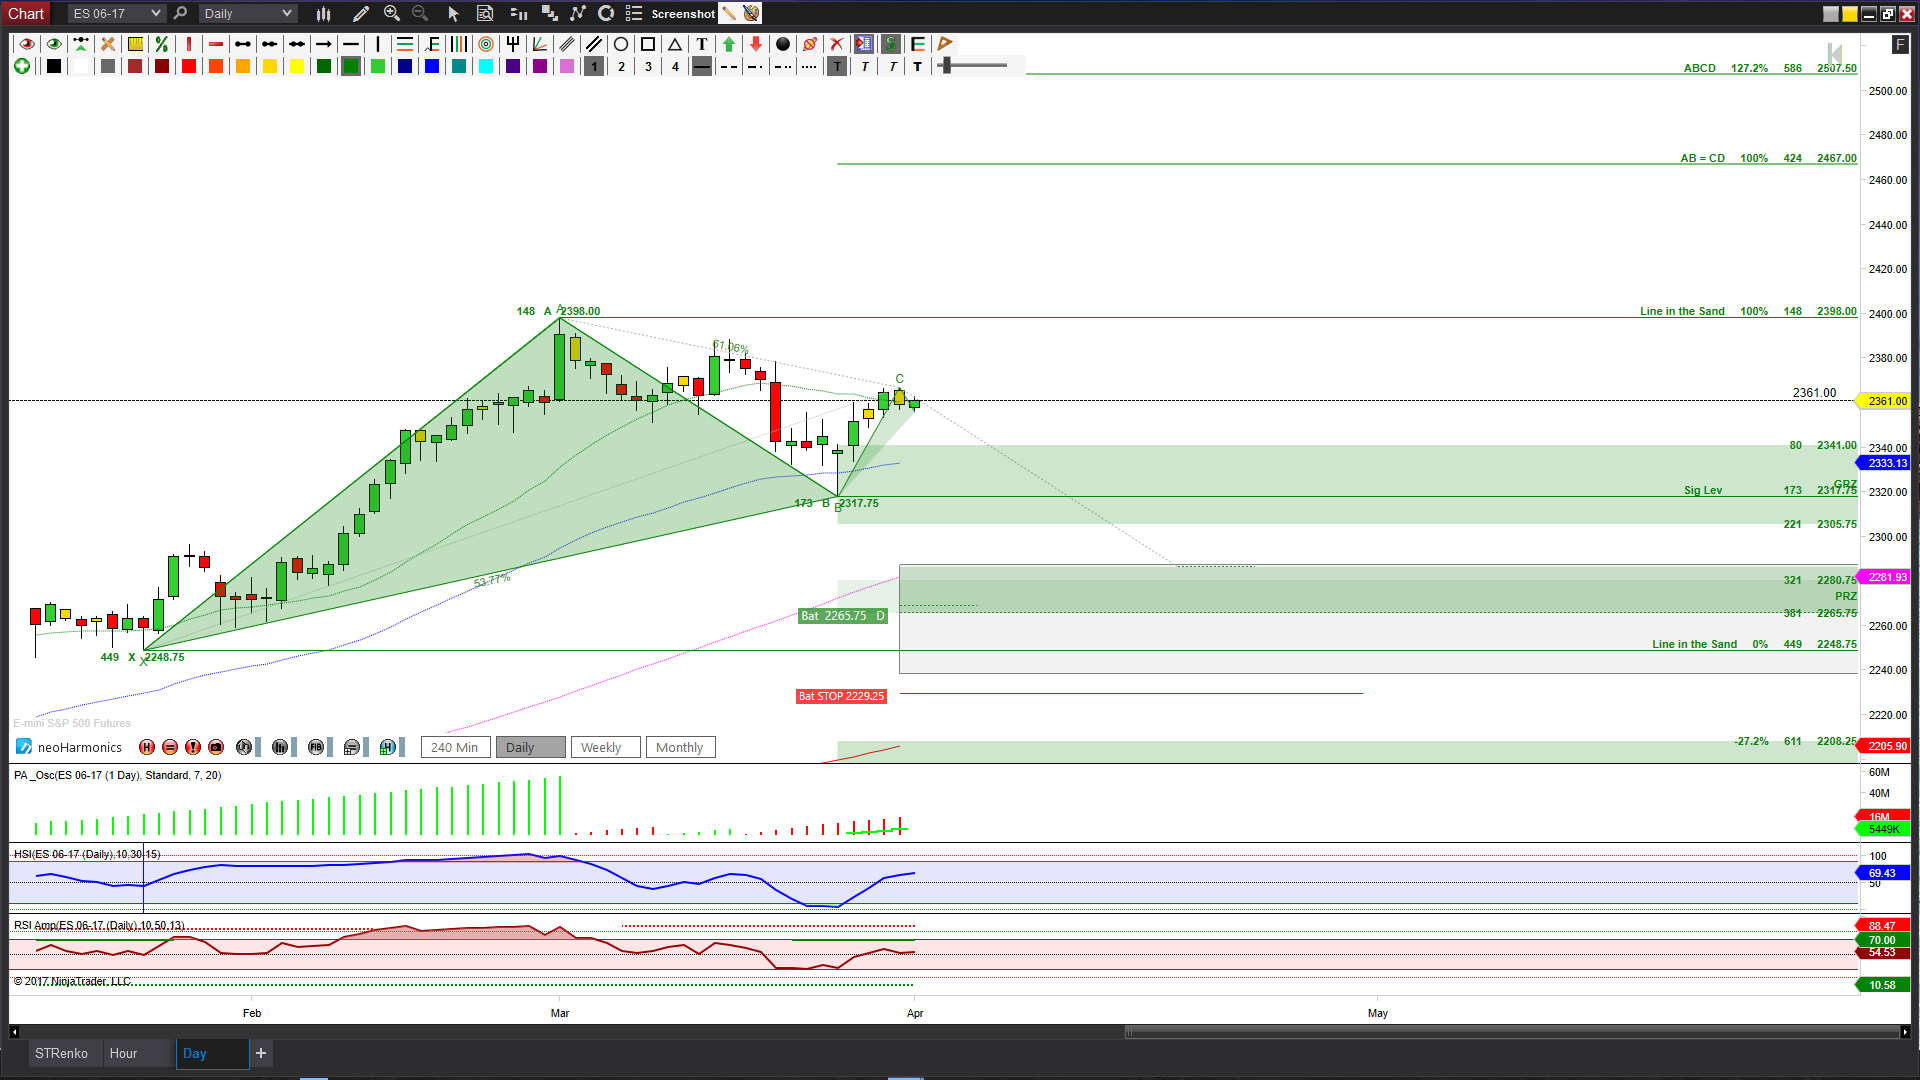
ES_F Day Chart

For the intraday perspective, I’m using an STRenko 20 bar chart on right and STRange 8 bar chart on left.
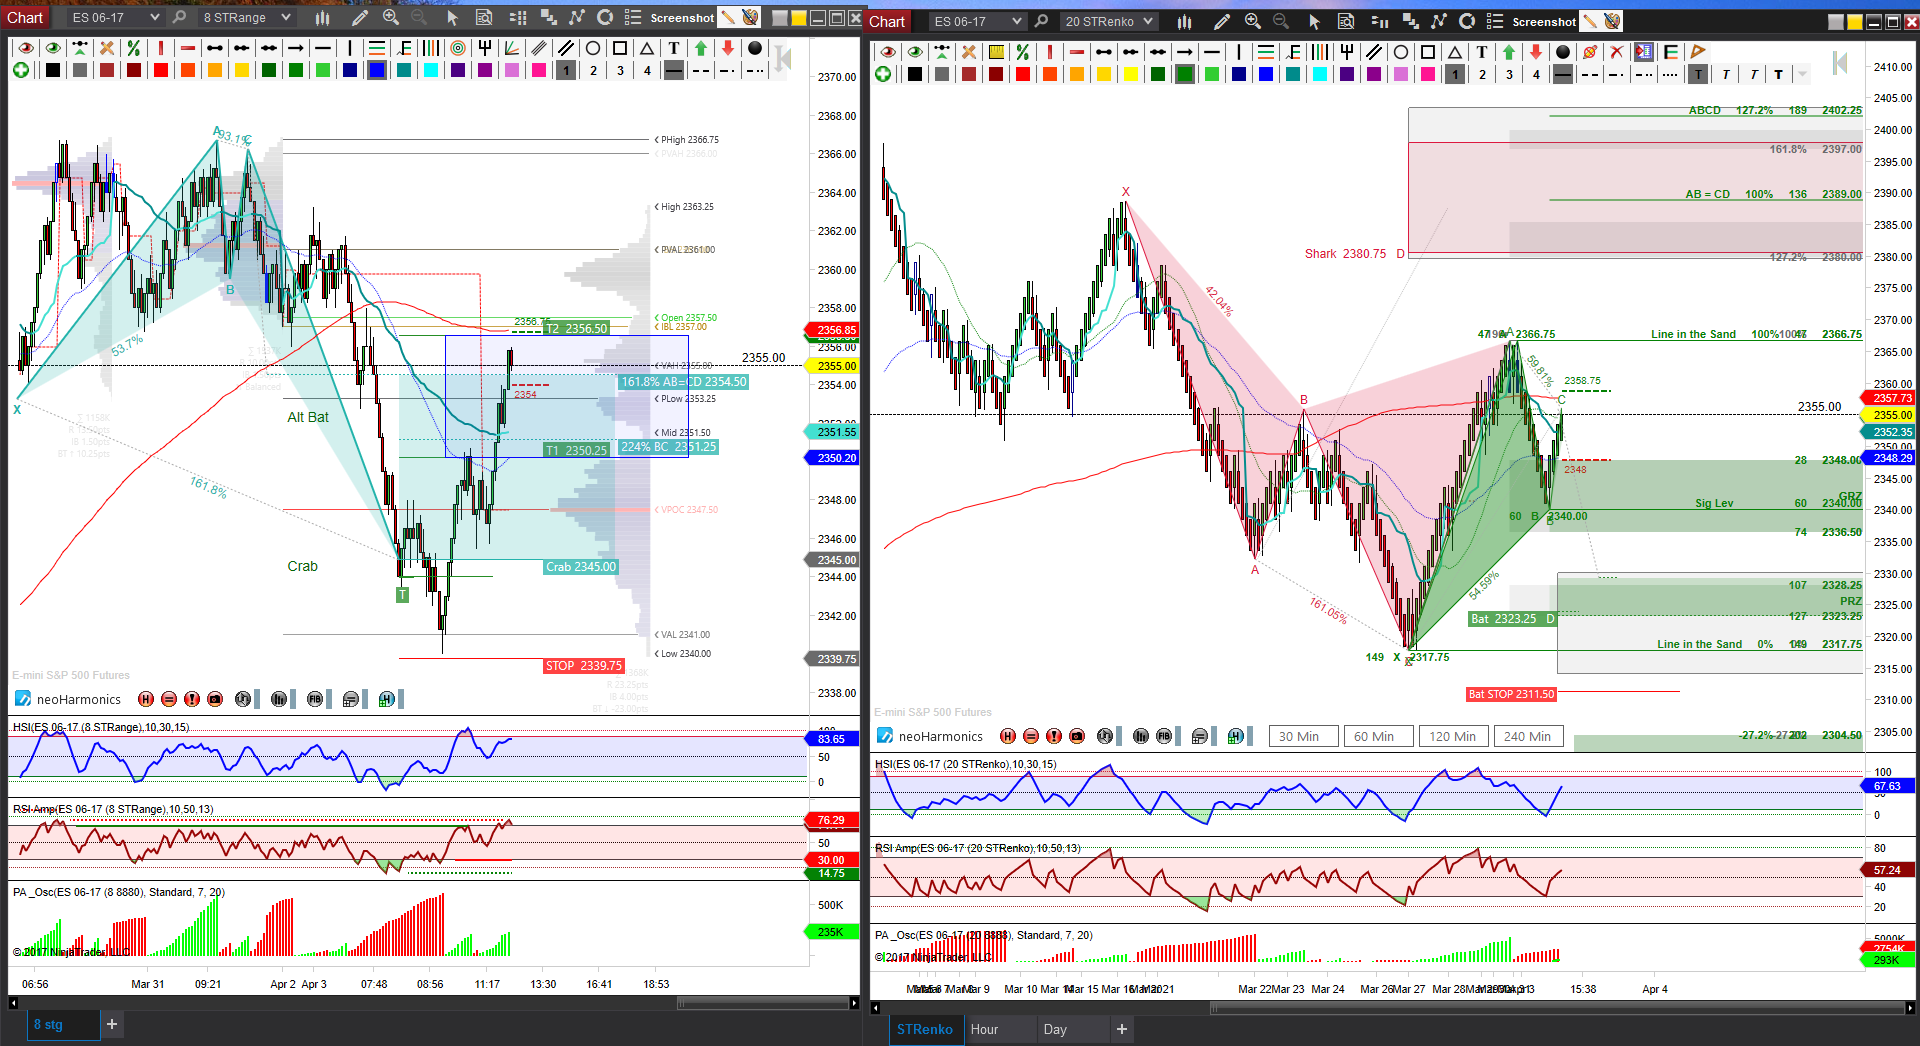
ES_F Intraday Chart

The STRenko 20 chart shows price is in between opposing emerging patterns but currently on upside pull thanks to STRange 8 retracing a cyan colored bullish Crab. Thus far ES has had an expansion day with very important resistance test at 2356.5 to 2357.5 region.

A hold above 2357.5 has magnet at 2361 area but harmonically speaking the ideal target is 2380, however due to existing expansion, the probability of latter target being tested today is not very high.

As long as price holds below 2356.5, the initial pullback target for key support test is 2350.25 to 2348, a break down there increases the probability of playing out the emerging green Bat at 2323.25.

Original post

Latest comments

Loading next article…
Risk Disclosure: Trading in financial instruments and/or cryptocurrencies involves high risks including the risk of losing some, or all, of your investment amount, and may not be suitable for all investors. Prices of cryptocurrencies are extremely volatile and may be affected by external factors such as financial, regulatory or political events. Trading on margin increases the financial risks.
Before deciding to trade in financial instrument or cryptocurrencies you should be fully informed of the risks and costs associated with trading the financial markets, carefully consider your investment objectives, level of experience, and risk appetite, and seek professional advice where needed.
Fusion Media would like to remind you that the data contained in this website is not necessarily real-time nor accurate. The data and prices on the website are not necessarily provided by any market or exchange, but may be provided by market makers, and so prices may not be accurate and may differ from the actual price at any given market, meaning prices are indicative and not appropriate for trading purposes. Fusion Media and any provider of the data contained in this website will not accept liability for any loss or damage as a result of your trading, or your reliance on the information contained within this website.
It is prohibited to use, store, reproduce, display, modify, transmit or distribute the data contained in this website without the explicit prior written permission of Fusion Media and/or the data provider. All intellectual property rights are reserved by the providers and/or the exchange providing the data contained in this website.
Fusion Media may be compensated by the advertisers that appear on the website, based on your interaction with the advertisements or advertisers.
© 2007-2025 - Fusion Media Limited. All Rights Reserved.