ES Flat-Bottomed Rising-Top Megaphone Data

Published 10/11/2015, 01:59 AM
Updated 07/09/2023, 06:31 AM
SPY
-
ESH25
-

ES Weekly Chart

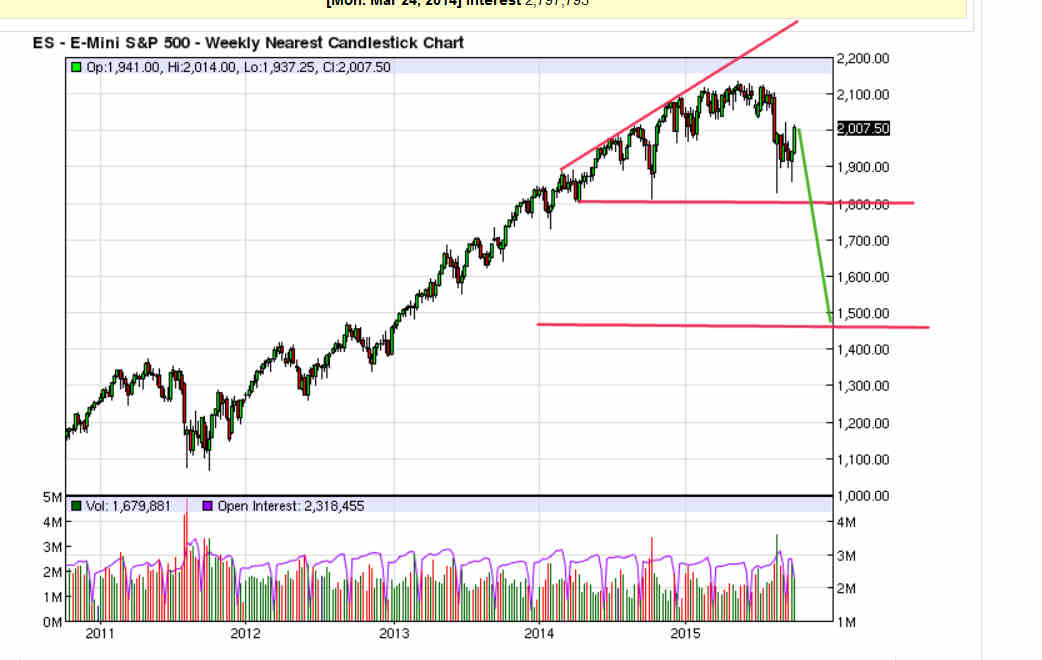
Flat-Bottomed Rising-Top Megaphone (Red) on ES with Target

I’ve already discussed the flat-bottomed rising-top megaphone (red on chart) on ES and NYSE:SPY in other posts. This post is to provide more data on how these trading formations play out. All data in this post comes from Bulkowski’s Encyclopedia of Chart Patterns.

First, 2/3 of these formations are reversal formations, meaning they break out the bottom after an upwards price run.

So, even without the NYMO lower low set-up I’ve discussed many times on this blog, ES would be a strong favorite to take out the August 24 low based on this formation.

The technical target for this formation is a little below ES 1500. There is a Neely trend change signal on the chart–if we’re now in a bear market, the percentage of bottom breakouts meeting that target would be 51%. If we’re still really in a bull market, the percentage meeting that target would be 32%.

In a bear market, downward breakouts tend to move fast, with roughly half of downward breakouts reaching their ultimate low in less than two weeks, and 31% reaching their ultimate low within 7 days.

Bulkowski considers a breakout that travels less than 5% a breakout failure. In a bear market, only 8% of downwards breakouts lead to breakout failure. In a bull market, 20% of downward breakouts result in breakout failure.

A breakout failure would target a new all-time high. On SPY, any low after breakout above 172.24 would be a breakout failure.

Downward breakouts travel 10% or more 78% of the time in a bear market, or 54% of the time in a bull market.

Right shoulders (partial pullbacks from the formation bottom before breakout) lead to a breakout through the bottom 74% of the time in a bull market and 79% of the time in a bear market. The average decline after bottom breakout in a formation with a right shoulder is 20%.

Downwards breakouts tend to do best when the breakout level is at the low for the previous year, which it would be in the present case.

Original post

Latest comments

Loading next article…
Risk Disclosure: Trading in financial instruments and/or cryptocurrencies involves high risks including the risk of losing some, or all, of your investment amount, and may not be suitable for all investors. Prices of cryptocurrencies are extremely volatile and may be affected by external factors such as financial, regulatory or political events. Trading on margin increases the financial risks.
Before deciding to trade in financial instrument or cryptocurrencies you should be fully informed of the risks and costs associated with trading the financial markets, carefully consider your investment objectives, level of experience, and risk appetite, and seek professional advice where needed.
Fusion Media would like to remind you that the data contained in this website is not necessarily real-time nor accurate. The data and prices on the website are not necessarily provided by any market or exchange, but may be provided by market makers, and so prices may not be accurate and may differ from the actual price at any given market, meaning prices are indicative and not appropriate for trading purposes. Fusion Media and any provider of the data contained in this website will not accept liability for any loss or damage as a result of your trading, or your reliance on the information contained within this website.
It is prohibited to use, store, reproduce, display, modify, transmit or distribute the data contained in this website without the explicit prior written permission of Fusion Media and/or the data provider. All intellectual property rights are reserved by the providers and/or the exchange providing the data contained in this website.
Fusion Media may be compensated by the advertisers that appear on the website, based on your interaction with the advertisements or advertisers.
© 2007-2025 - Fusion Media Limited. All Rights Reserved.