Disclaimer: Contrarian thoughts to follow
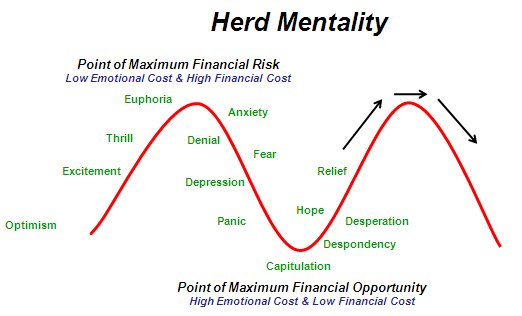
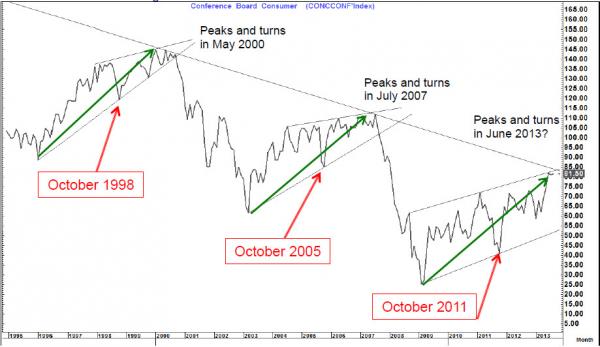
In my opinion, equity markets in the US and abroad are now driven primarily by Central Bank Liquidity (artificially low rates) which incents leverage and the reach for yield. Herd mentality is powerful and I fear that if/when Consumer Confidence turns, so too will US/Global equities. Furthermore, the leading sectors over the past few years are showing signs of exhaustion. Caution is warranted, particularly as our dysfunctional Congress threatens another shutdown.
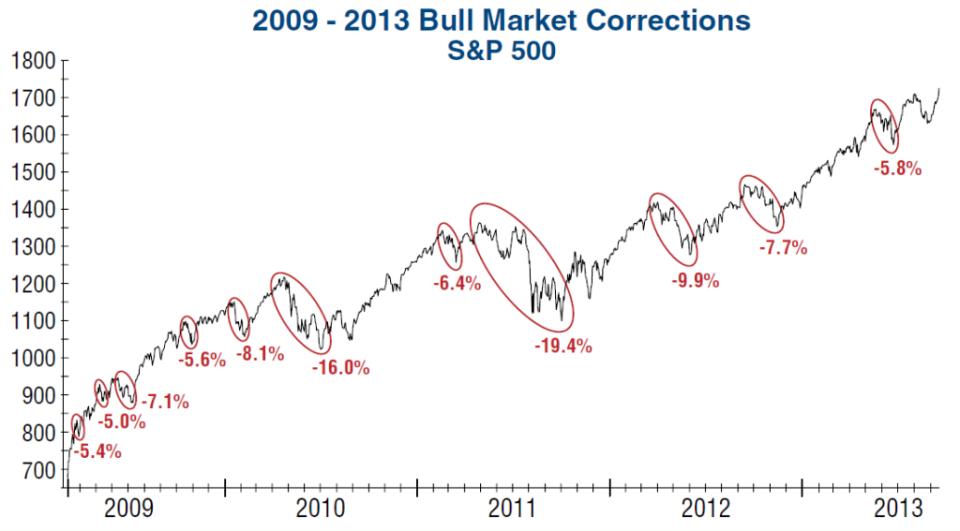
The Fed's decision to "punt" last week confused many. What conditions need to be satisfied? Bernanke unwilling to start the Taper process? Hot potato passed to Yellen? Since 2009, Equities have had TWO "big" pullbacks and a number of single digit percentage drops. The 16% move lower in 2010 and the 19.4% shakeout in 2011 were the ONLY STRETCHES in the past 5 years when the Federal Reserve was NOT BUYING TREASURIES/MBS. Coincidence? At some point, they will begin the tapering process. I don't think Mr. Market will respond well.
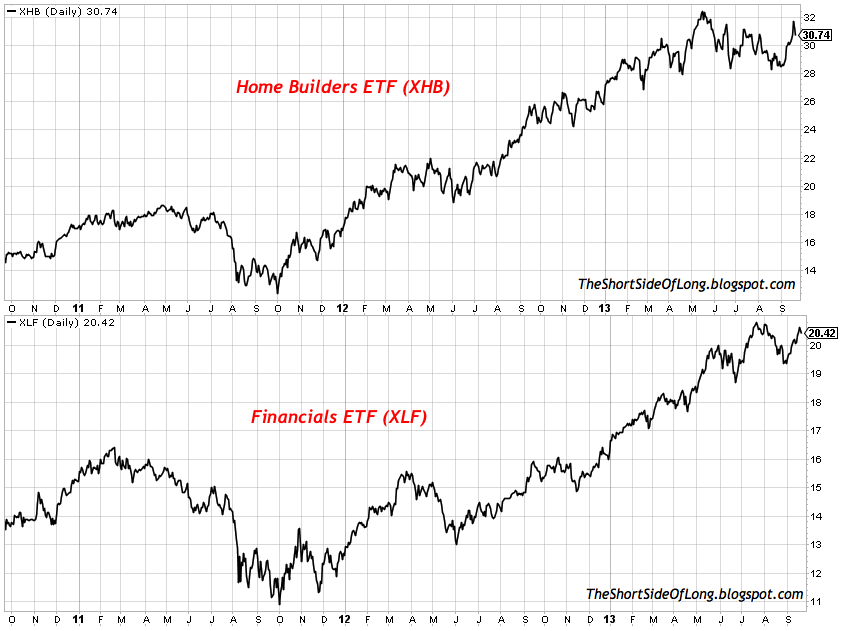
Over the past 5 years the areas hardest hit during the 2008 Financial Crisis (Housing and Banks) have led the way higher. Are they about to roll over?
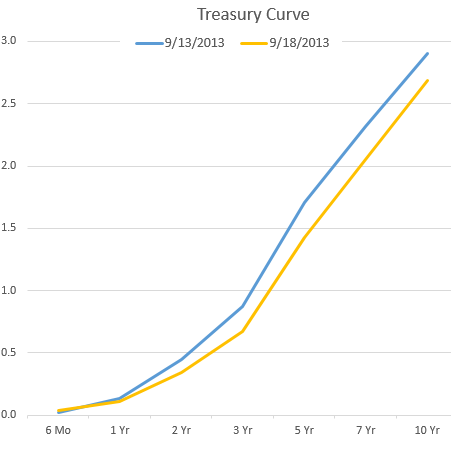
Furthermore, the yield curve was steeper than it's been in many years going into last week's FOMC and despite the Fed's efforts to keep the gravy train on the rails (Steep Curve is very friendly for Banks)...it's beginning to flatten. If that continues - be very careful. Dodd Frank, Basel III, lower leverage ratios?
Consumer confidence has been waning. I DON'T BELIEVE YOU CAN OVERSTATE THE IMPORTANCE of the CONSUMER'S SENTIMENT. 70% of GDP is consumer driven. The sub sets of consumer confidence have been rolling over as well. See this LINK.
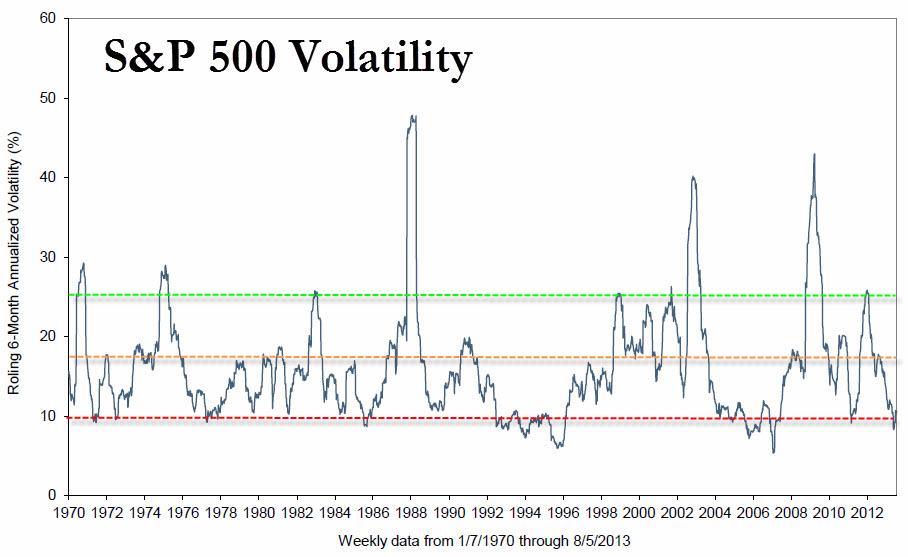
Volatility has been artificially suppressed in the Zero Interest Rate Environment as well.
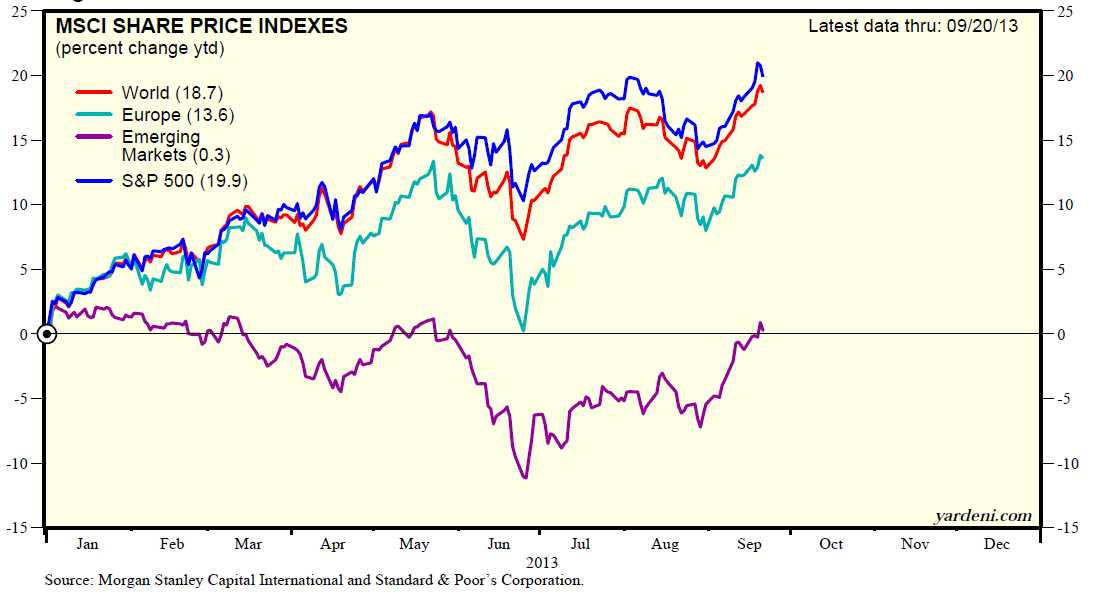
The S&P compared to World/Emerging Markets/the European Union. Europe = lower highs. Emerging markets = lower highs. Careful.
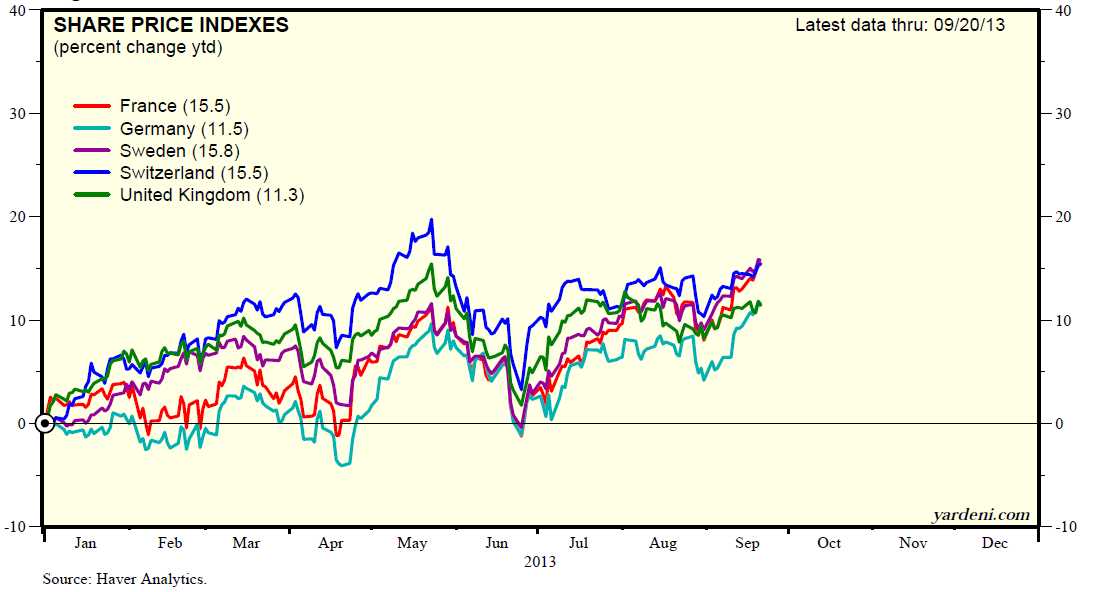
A closer look at lower European highs. Who is right?
- French, German, Sweden - NEW HIGHS (Manufacturing)
- UK and Swiss - LOWER HIGHS (UK and Switzerland = EU Banking havens)
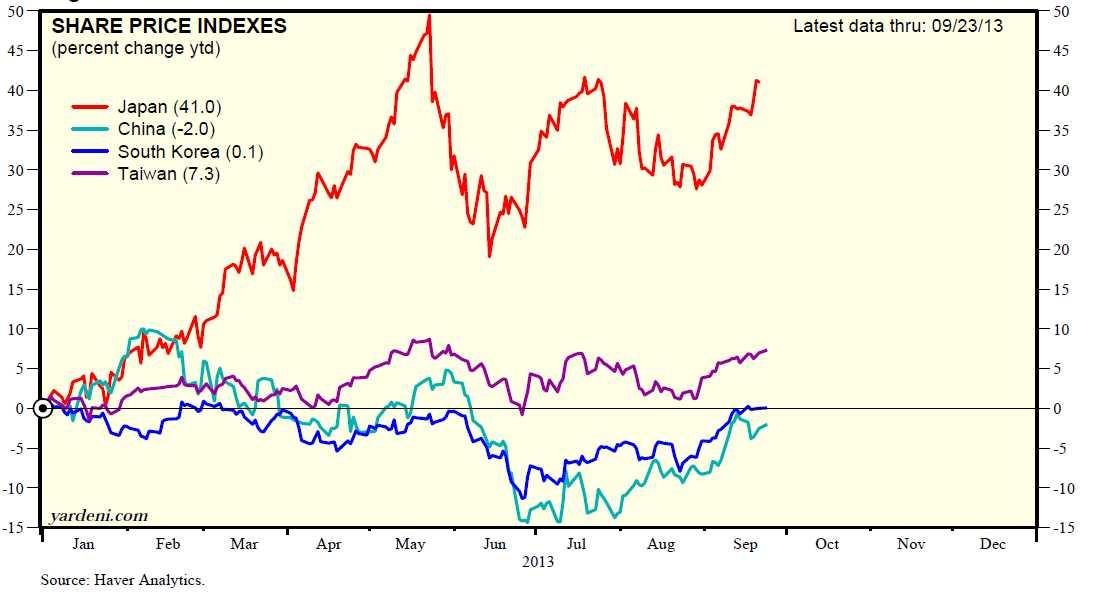
Japanese markets are making lower highs. Abenomics/Bank of Japan are still actively pursuing Quantitative Easing (currency debasement) to spur growth.
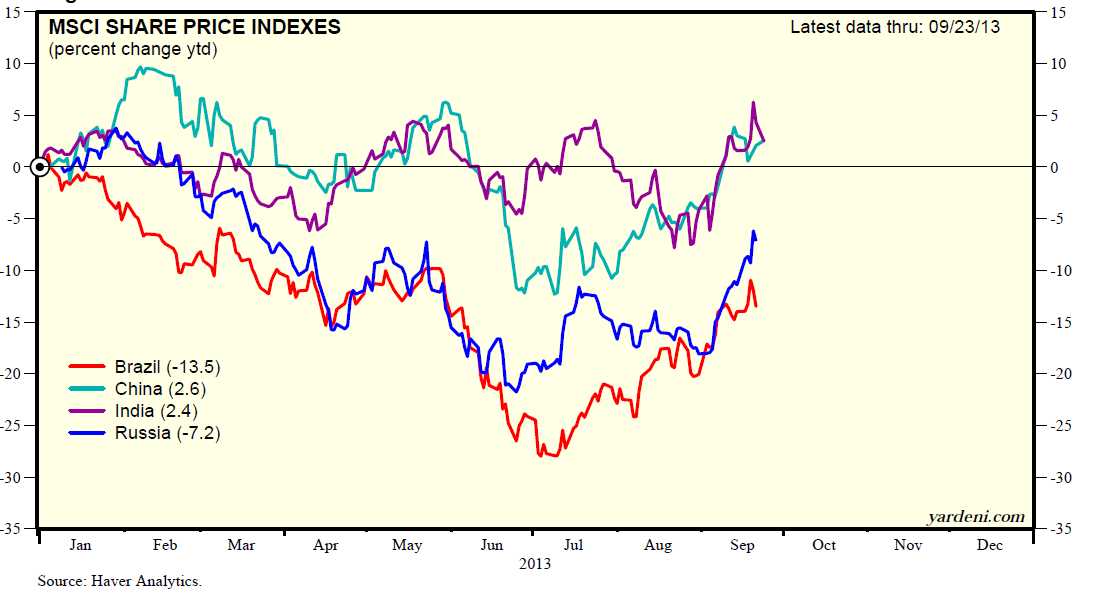
BRIC performance YTD. Watch China. After short term rates popped HARD (Shibor) following Bernanke's (5/22) comments their market's sold off considerable. Since then, they've made efforts to stabilize the shadow banking......without it there are serious problems!
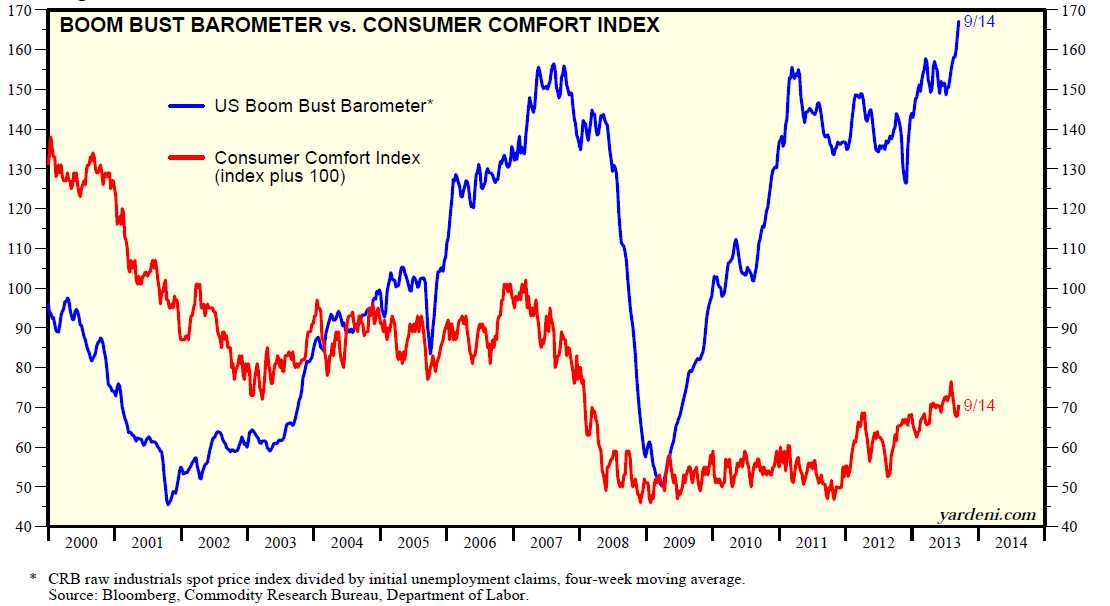
And take a look at this (Yardeni) Boom Bust Barometer. It's higher than it was in 2007 and Consumer Comfort is headed the wrong way. Tinder box?
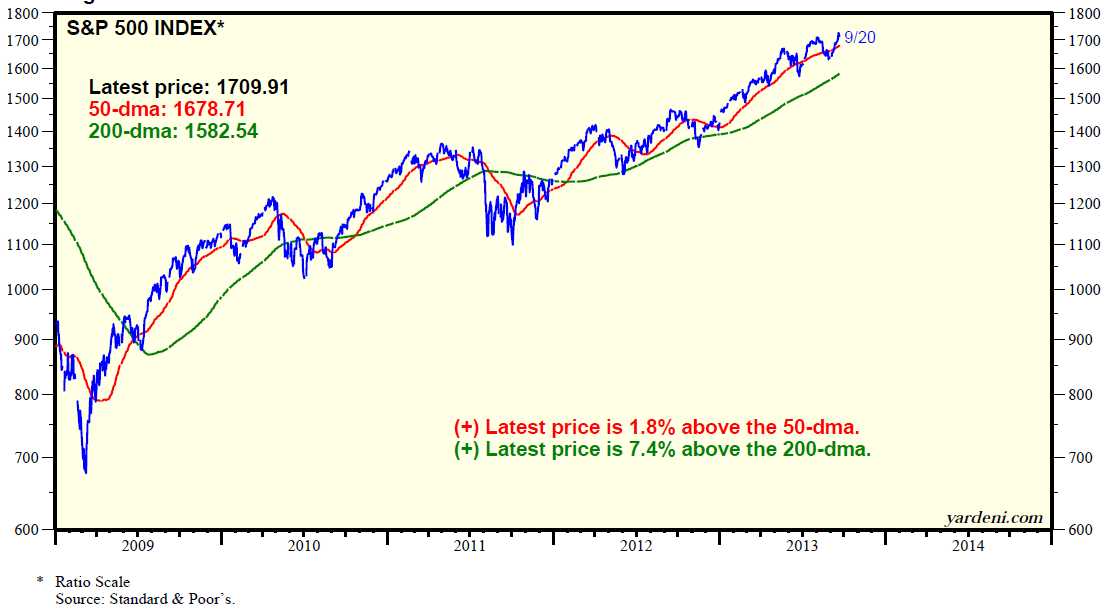
The S&P v its 50 and 200 day moving averages. Since the March 2009 equity lows, the S&Ps have only tested/broken the 200 day moving average on a few occasions.
- March 2010 as the Greek Bailout (the first of three) threw Europe into turmoil.
- August/September of 2011 - PIIGs - Bonds yields in European periphery spike. US Debt downgrade. Global fear spike.
- November 2012 - following US and just preceding Japanese elections.
Caveat: I tend to be a contrarian, which is very difficult with regular interventions in once ostensibly "free" markets. For the most part, I look to identify short term opportunities. This was an effort to look at the broader landscape which I believe is becoming increasingly unsteady. I could be very wrong, but if you skew your risk v. reward favorably, that gives you the potential to be wrong and remain in the game. Identify where you're exposed to the most risk.
- Your 401k has probably done very well over the past few years. What happens if broad markets pull back 10%, 20%, more? How would that impact your bottom line? Can you do anything proactive to protect against tail risk?
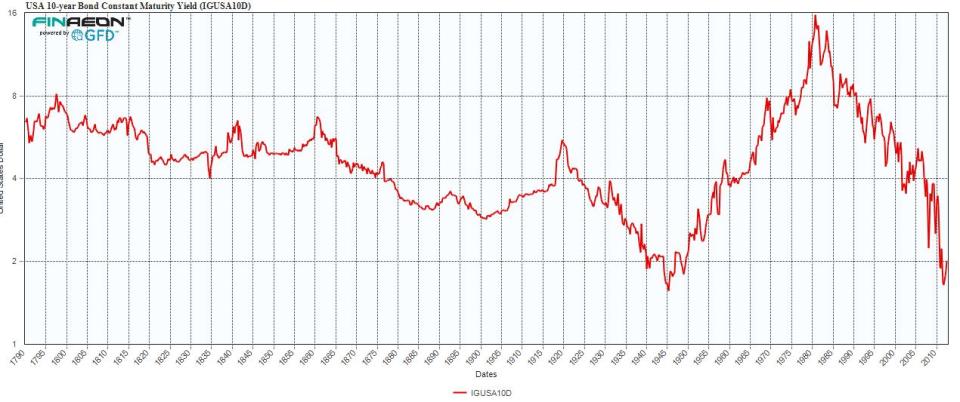
- What if rates continue to move higher? What impact might that have on your primary investments? Look at the US 10 year yield over the LONG term. We can't stay here forever.
Risk Disclaimer: This information is not to be construed as an offer to sell or a solicitation or an offer to buy the commodities and/ or financial products herein named. The factual information of this report has been obtained from sources believed to be reliable, but is not necessarily all-inclusive and is not guaranteed to be accurate. You should fully understand the risks associated with trading futures, options and retail off-exchange foreign currency transactions (“Forex”) before making any trades. Trading futures, options, and Forex involves substantial risk of loss and is not suitable for all investors. You should carefully consider whether trading is suitable for you in light of your circumstances, knowledge, and financial resources. You may lose all or more than your initial investment. Opinions, market data, and recommendations are subject to change without notice. Past performance is not necessarily indicative of future results. This report contains research as defined in applicable CFTC regulations. Both RCM Asset Management and the research analyst may have positions in the financial products discussed.
