Ten years ago Standard and Poor's released its Equal Weighted S&P 500 Index (EWI). Since that time a number of index firms have created equal weighted ETFs that investors are able to invest in directly. In S&P's recently released white paper, 10 Years Later: Where In The World Is Equal Weight Indexing Now?, they cover a great deal of the historical data on the equal weighted index relative to the more common market cap weighted S&P 500 Index.
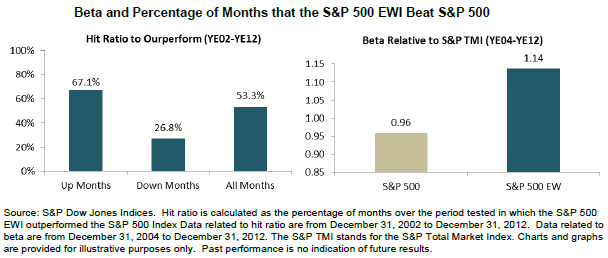
Due to the cap weighted nature of the S&P 500, one obvious characteristic is the EWI S&P 500 is more heavily weighted in the smaller capitalization stocks and underweighted in the large cap stocks of the S&P 500 Index. Because of this factor, S&P demonstrates the equal weighted index does have a tendency to outperform more frequently in up markets than in down markets and the EWI does carry a higher beta.
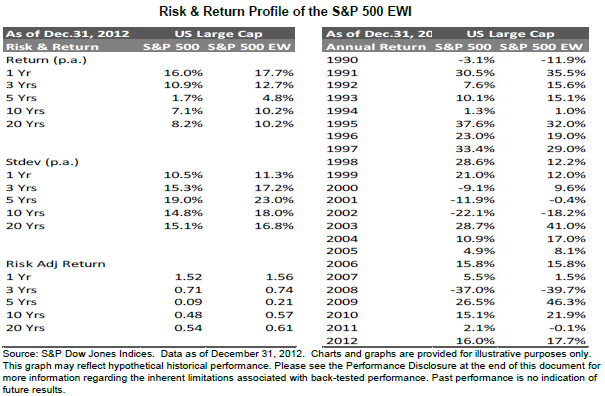
In addition to more frequent up market outperformance, over a longer time frame, the EW S&P 500 Index has outperformed the cap weighted S&P 500 Index.
Given the emergence of technology and the tech sector leading up to the technology bubble in 2000, one might believe performance differences between equal weighted and cap weighted indices is due to the differing sector weights. However, one must keep in mind the sector weighting within the EWI is determined by the number of companies that make up the overall index. As noted by S&P:
"Since 1999, the S&P 500 EWI has been consistently overweighted materials, consumer discretionary and utilities, and underweighted energy, health care and telecommunication services relative to the S&P 500. However, for other sectors the situation has varied considerably over time. In fact, even for sectors for which the S&P 500 EWI has been consistently overweight or underweight, the difference in concentration between the two indices has altered significantly.
Throughout the history, the largest change in the relative sector weights of the two indices has been in the information technology (IT) sector, mainly due to the change in the sector weights of the S&P 500 itself. During the technology bubble in the late 1990s, the IT sector weight of the S&P 500 increased to 33% in March 2000 from 13% at the start of 1998. Correspondingly, the S&P 500 EWI went from being underweight in the sector by less than 3% to being underweight by more than 20% in the same period. This has a very important implication that explains the different performance of the S&P 500 EWI relative to the S&P 500..."
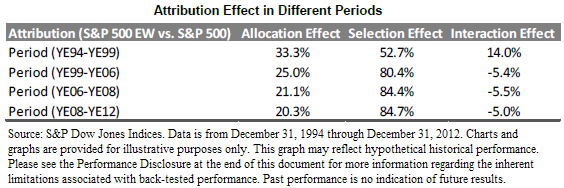
S&P's paper does indicate the performance differences are more attributable to selection effects than allocation effects though. 
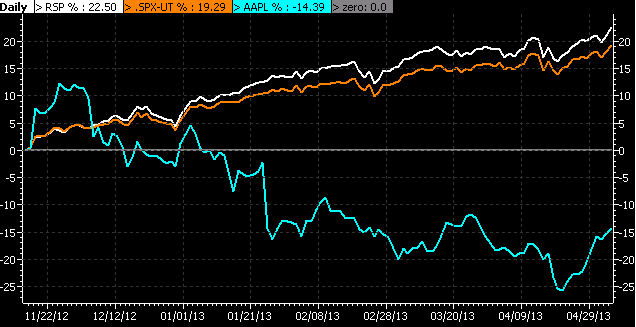
A recent example of this selection impact can be seen in the below chart comparing the S&P cap weighted and equal weighted (RSP) performance relative to Apple's (AAPL) stock price performance. RSP is the Guggenhiem S&P 500 Equal Weighted ETF. Apple remains the largest holding in the cap weighted S&P 500 Index and its significant underperformance since mid November has contributed to the cap weighted index underperforming the equal weighted index.
For investors then, an equal weighted approach may not result in outperformance on an every year basis; however, it has proven to outperform over longer time frames. Additionally, the EWI is rebalanced on a quarterly basis, thus, leading to a strategy that results in selling high and buying low.
- English (UK)
- English (India)
- English (Canada)
- English (Australia)
- English (South Africa)
- English (Philippines)
- English (Nigeria)
- Deutsch
- Español (España)
- Español (México)
- Français
- Italiano
- Nederlands
- Polski
- Português (Portugal)
- Português (Brasil)
- Русский
- Türkçe
- العربية
- Ελληνικά
- Svenska
- Suomi
- עברית
- 日本語
- 한국어
- 简体中文
- 繁體中文
- Bahasa Indonesia
- Bahasa Melayu
- ไทย
- Tiếng Việt
- हिंदी
Equal Weighted S&P 500 Index: Insights, 10 Years Later
Published 05/06/2013, 01:31 AM
Updated 07/09/2023, 06:31 AM
Equal Weighted S&P 500 Index: Insights, 10 Years Later
Latest comments
Loading next article…
Install Our App
Risk Disclosure: Trading in financial instruments and/or cryptocurrencies involves high risks including the risk of losing some, or all, of your investment amount, and may not be suitable for all investors. Prices of cryptocurrencies are extremely volatile and may be affected by external factors such as financial, regulatory or political events. Trading on margin increases the financial risks.
Before deciding to trade in financial instrument or cryptocurrencies you should be fully informed of the risks and costs associated with trading the financial markets, carefully consider your investment objectives, level of experience, and risk appetite, and seek professional advice where needed.
Fusion Media would like to remind you that the data contained in this website is not necessarily real-time nor accurate. The data and prices on the website are not necessarily provided by any market or exchange, but may be provided by market makers, and so prices may not be accurate and may differ from the actual price at any given market, meaning prices are indicative and not appropriate for trading purposes. Fusion Media and any provider of the data contained in this website will not accept liability for any loss or damage as a result of your trading, or your reliance on the information contained within this website.
It is prohibited to use, store, reproduce, display, modify, transmit or distribute the data contained in this website without the explicit prior written permission of Fusion Media and/or the data provider. All intellectual property rights are reserved by the providers and/or the exchange providing the data contained in this website.
Fusion Media may be compensated by the advertisers that appear on the website, based on your interaction with the advertisements or advertisers.
© 2007-2025 - Fusion Media Limited. All Rights Reserved.
