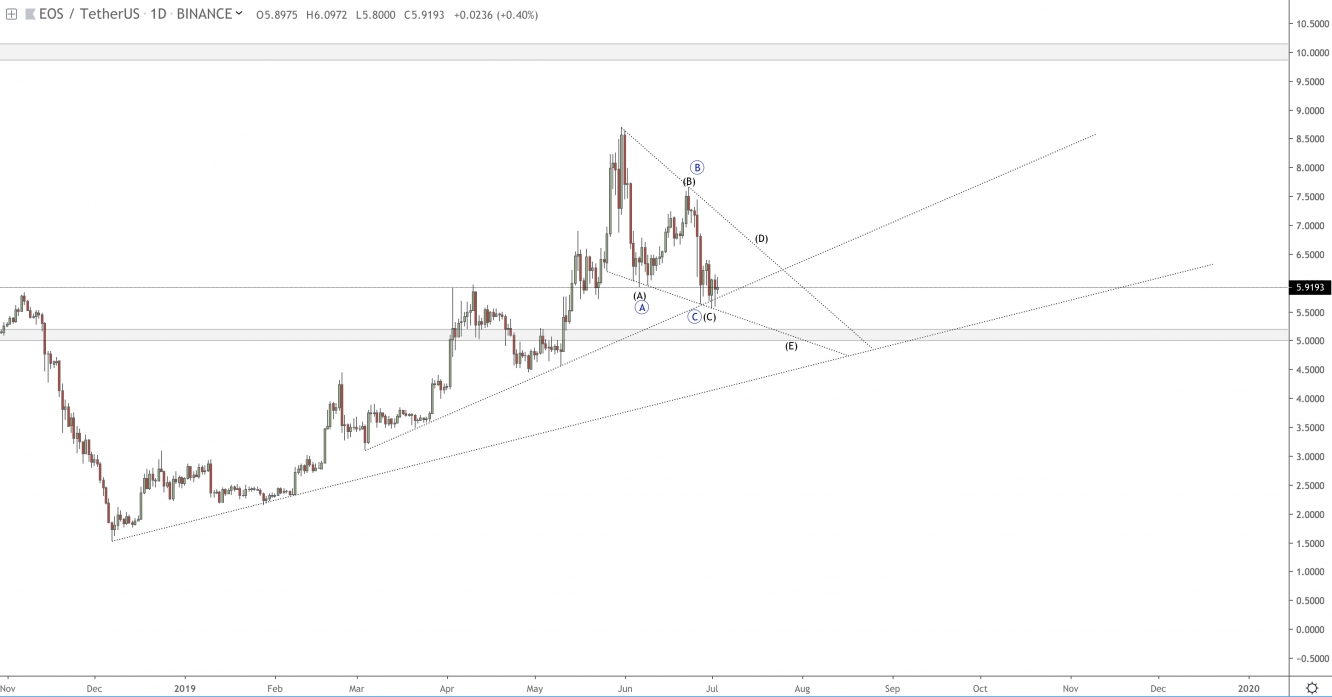
After a heavy surge of 470% from the trough of last year's bear market, EOS/USD found its temporarily top at $8.70. Despite the pullback of 35%, the overall price structure shows strong evidence of EOS still being in an uptrend.
Bears are clearly losing momentum as the first significant support at $5.70 and the major ascending trendline have been hit simultaneously. Sellers have been trying hard to violate the key level at $5.70, but failed as bulls pushed back price above the major support before the daily close.
The 4-hour chart already shows a bullish divergence, however, the short-term technicals should be taken with a grain of salt, as there is still the possibility of price visiting the $5.15-5.00 area before starting the next bullish impulse.
The daily chart shows a much clearer picture. Price is clearly moving within a falling wedge and is either unfolding in an ABC structure, which has been already completed - or in an ABCDE structure.
The latter would mean that price might climb a bit higher, in order to complete wave D, just to get rejected once again at possibly the $6.65-6.85 range for the completion of wave E.
With regards to the upside target, the level of $9.45 as well as the area of $9.85-10.15 represent the next liquidity areas.
Verdict:
Bullish. The structure on higher timeframes is a very clear one. No lower lows as of yet, No major support being violated, a falling wedge in the making - which has already been completed or still has to complete a wave D and E. Considering the historical price structure and behaviour of EOS, it is important to note that this one took off many times before the perfect textbook chart pattern, for which people have been waiting, has been completed.

