Breaking News
Get 45% Off 0
🌊 NVIDIA ripple effect: Track AI stocks' response to chip giant's earnings
Explore AI Stocks

Enormous Triangle Forms On EUR/CHF Chart

By Blackwell Global (Ross Woodfield)CurrenciesAug 06, 2014 02:25AM ET
www.investing.com/analysis/enormous-triangle-forms-on-eur-chf-chart-221786
Enormous Triangle Forms On EUR/CHF Chart
By Blackwell Global (Ross Woodfield)   |  Aug 06, 2014 02:25AM ET
Saved. See Saved Items.
This article has already been saved in your Saved Items
 
 
EUR/CHF
-0.22%
Add to/Remove from Watchlist
Add to Watchlist
Add Position

Position added successfully to:

Please name your holdings portfolio
 

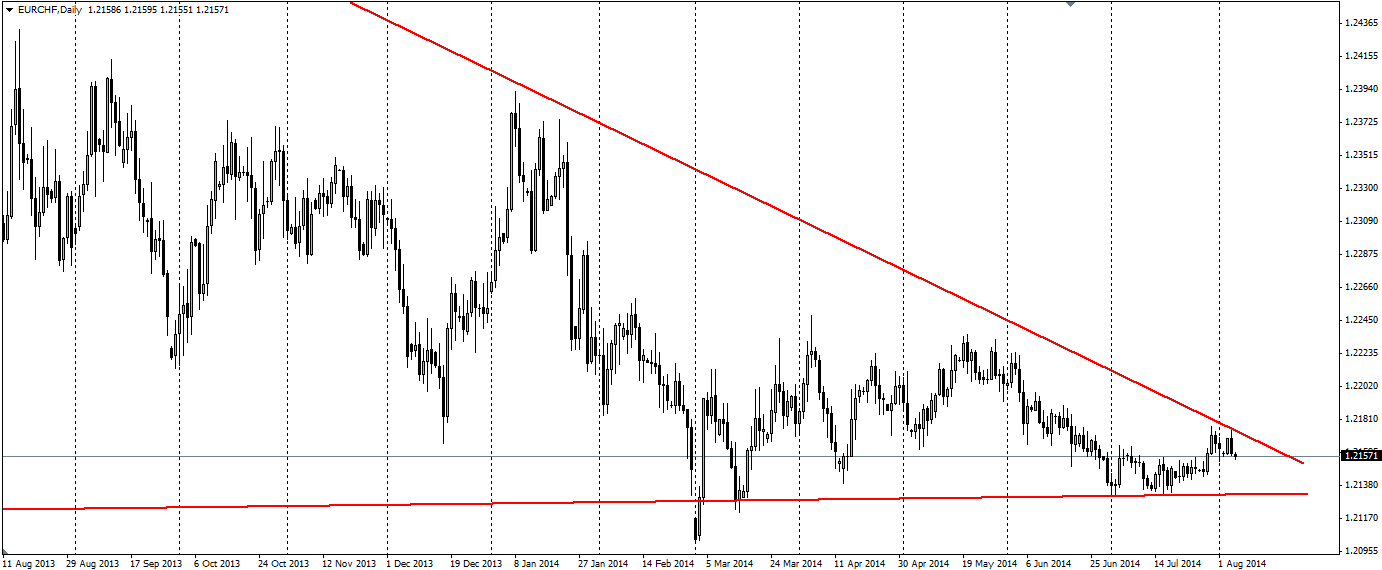
Over the last 18 months a huge triangle has formed between the Euro and the Franc. With a price floor in place, a breakout lower for the EURCHF will not be going any lower than 1.20, however, a breakout higher could be large.

EUR/CHF
EUR/CHF

In early 2013, the EURCHF pair was extremely volatile as the EU emerged from the sovereign debt crisis that threatened to break up the Euro zone. At the peak of the crisis the price floor at 1.2 Euros per Franc between the two was put to the test as capital fled the EU for the safety of the Swiss Alps. The Floor was put in place by Switzerland’s central bank (the SNB) to combat falling inflation. Since interest rates were already at zero, they saw the price floor as the most appropriate strategy to prevent deflation by keeping the currency artificially weak and therefore imports artificially high. The SNB even pledged to “defend the floor with unlimited reserves”.

Once confidence returned the capital outflows led to extreme volatility between the pair which has slowly been diminishing. The stimulus in the EU has led to the descending bearish trend as the return differential between the two currencies diminishes. Also at the first signs of a crisis the pull of the ‘safe haven’ title the Franc affords leads to capital outflows from the Euro zone.

If we see more stimulus from the ECB, which is a distinct possibility given the falling inflation rate has fallen to just 0.4%, we will see a breakout of the support that forms the bottom of the triangle around 1.2132. The ECB is meeting at the end of this week, so we will know where they stand by then. A movement lower will be cut short by the price floor at 1.2000, making it a 132 pip movement at maximum. From here, it’s a pretty safe long given the stance of the SNB and their “unlimited reserves”.

A breakout to the upside is a possibility if inflation returns to the EU. We are seeing some positive signs in the form of Services PMIs from Germany at 56.7 and France at 50.4, and also Spain’s unemployment rate coming down to 24.5% along with the EU wide unemployment falling to 11.5%. Furthermore, it looks like the Swiss economy is feeling a bit of stress with the KOF economic barometer falling to 98.10 from 100.50, however we will know more by the end of the week when Swiss CPI and Unemployment is reported.

Enormous Triangle Forms On EUR/CHF Chart
 

Related Articles

Andrey Goilov
USD/JPY Consolidates as Yen Strength Stalls Near Highs By Andrey Goilov - Feb 27, 2025

USD/JPY is consolidating near 149.33 on Wednesday, with the yen pausing its rally while holding near four-month highs against the USD. This stabilisation follows renewed support...

Enormous Triangle Forms On EUR/CHF Chart

Add a Comment

Comment Guidelines

We encourage you to use comments to engage with other users, share your perspective and ask questions of authors and each other. However, in order to maintain the high level of discourse we’ve all come to value and expect, please keep the following criteria in mind:  

  •            Enrich the conversation, don’t trash it.

  •           Stay focused and on track. Only post material that’s relevant to the topic being discussed. 

  •           Be respectful. Even negative opinions can be framed positively and diplomatically. Avoid profanity, slander or personal attacks directed at an author or another user. Racism, sexism and other forms of discrimination will not be tolerated.

  • Use standard writing style. Include punctuation and upper and lower cases. Comments that are written in all caps and contain excessive use of symbols will be removed.
  • NOTE: Spam and/or promotional messages and comments containing links will be removed. Phone numbers, email addresses, links to personal or business websites, Skype/Telegram/WhatsApp etc. addresses (including links to groups) will also be removed; self-promotional material or business-related solicitations or PR (ie, contact me for signals/advice etc.), and/or any other comment that contains personal contact specifcs or advertising will be removed as well. In addition, any of the above-mentioned violations may result in suspension of your account.
  • Doxxing. We do not allow any sharing of private or personal contact or other information about any individual or organization. This will result in immediate suspension of the commentor and his or her account.
  • Don’t monopolize the conversation. We appreciate passion and conviction, but we also strongly believe in giving everyone a chance to air their point of view. Therefore, in addition to civil interaction, we expect commenters to offer their opinions succinctly and thoughtfully, but not so repeatedly that others are annoyed or offended. If we receive complaints about individuals who take over a thread or forum, we reserve the right to ban them from the site, without recourse.
  • Only English comments will be allowed.
  • Any comment you publish, together with your investing.com profile, will be public on investing.com and may be indexed and available through third party search engines, such as Google.

Perpetrators of spam or abuse will be deleted from the site and prohibited from future registration at Investing.com’s discretion.

Write your thoughts here
 
Are you sure you want to delete this chart?
 
Post
Post also to:
 
Replace the attached chart with a new chart ?
1000
Your ability to comment is currently suspended due to negative user reports. Your status will be reviewed by our moderators.
Please wait a minute before you try to comment again.
Thanks for your comment. Please note that all comments are pending until approved by our moderators. It may therefore take some time before it appears on our website.
 
Are you sure you want to delete this chart?
 
Post
 
Replace the attached chart with a new chart ?
1000
Your ability to comment is currently suspended due to negative user reports. Your status will be reviewed by our moderators.
Please wait a minute before you try to comment again.
Add Chart to Comment
Confirm Block

Are you sure you want to block %USER_NAME%?

By doing so, you and %USER_NAME% will not be able to see any of each other's Investing.com's posts.

%USER_NAME% was successfully added to your Block List

Since you’ve just unblocked this person, you must wait 48 hours before renewing the block.

Report this comment

I feel that this comment is:

Comment flagged

Thank You!

Your report has been sent to our moderators for review
Continue with Apple
Continue with Google
or
Sign up with Email