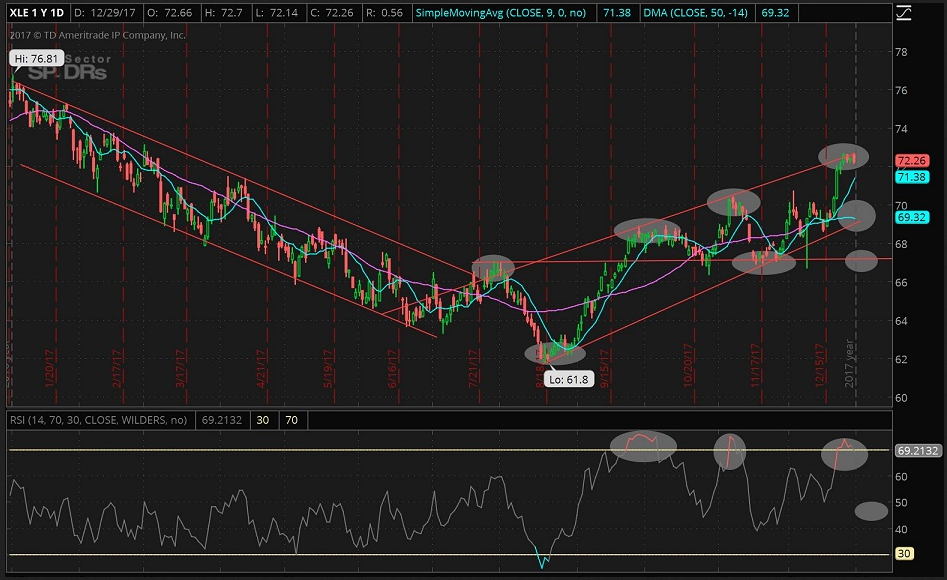
Here it is, the first chart of 2018! Let’s make this year even better than last year and continue to beat the markets together. This week’s Chart of the Week features Energy Select Sector SPDR (NYSE:XLE) (Energy Sector ETF) after WTI crude marked $60 for the first time in over two years. XLE has recently hit its highest level since March 2017 and this also happens to be the top end of an upward trending channel. We are now calling for a pullback in this ETF along with the oil markets as they both appear to be severely overbought.
The top end of the channel, as displayed above, has held several times this year, and we should see a drop to roughly $69 at the very least, which also happens to be the 50 day moving average. Additionally, when looking at the RSI, we also see a clear indication of overbought conditions with a recent peak near 75, the point where we saw the two previous reversals at the top line of the channel. On the way down, we look for $71.38 as a checkpoint and in the extreme case we could see a drop to ~$66-67 if the bottom end of the channel does not hold support.

Disclosure: None of the information or opinions expressed in this blog constitutes a solicitation for the purchase or sale of any security or other instrument. Nothing in this article constitutes investment advice and any recommendations that June be contained herein have not been based upon a consideration of the investment objectives, financial situation or particular needs of any specific recipient. Any purchase or sale activity in any securities or other instrument should be based upon your own analysis and conclusions.
