Oil and gas along with their equities have been underperforming for the most part of 2012 and they are still under heavy selling pressure.
I watch the oil futures chart very closely for price and volume action. And the one thing that is clear for oil is that big sellers are still unloading copious amounts of contracts which is keeping the price from moving higher. Oil is trading in a very large range and is trending its way back down the lower reversal zone currently. Once price reverses back up and starts heading towards the $100 and $105 levels it will trigger strong buying across the entire energy sector.
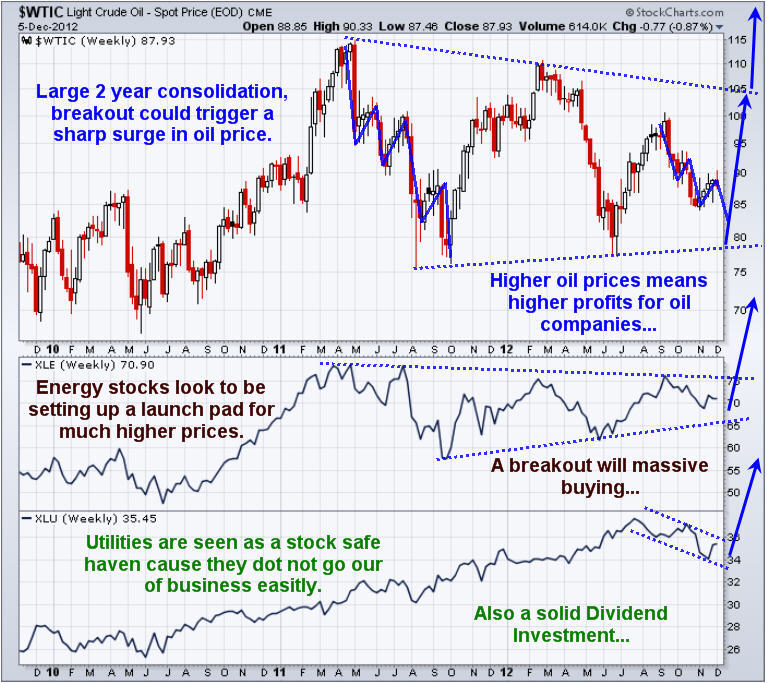
Crude Oil, Energy & Utility Sector Chart – Weekly Time Frame
The chart below shows the light crude oil price along with the energy and utilities sectors. The patterns on the chart are clearly pointing to higher prices but the price of oil must shows signs of strength before that will happen. Once XLE & XLU prices break above their upper resistance levels (blue dotted line) they should takeoff and provide double digit returns.
Looking at the XLU utilities sector above I am sure you noticed the steady rise in the price the last couple of years. This was a result in the low interest rates in bond price and a shift from investors looking for higher yields for their money. Utility stocks carry below average risk in the world of equities and pay out a steady and healthy dividend year after year. So this is where long term investment capital has/is being parked for the time being.
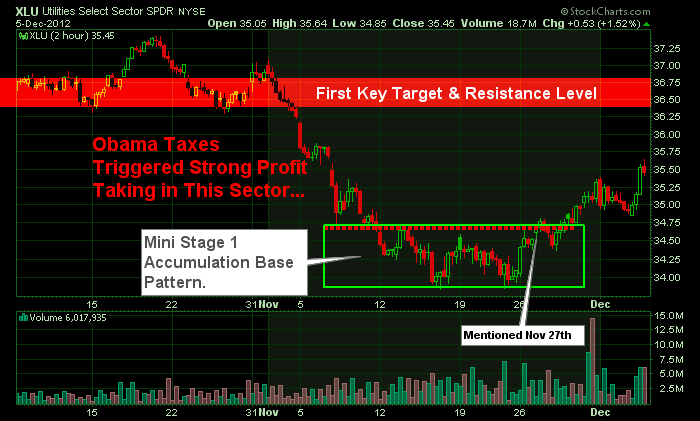
Utility Stock Sector – Deeper Look – 2 Hour Candle Chart Time Frame
Last week I covered utility stocks in detail showing you the Stage 1 – Accumulation base which they had formed. The chart below shows the recent price action on the 2 hour candle chart and recent run up. You can learn more about how to take advantage of this sector here: http://www.thegoldandoilguy.com/articles/its-the-season-to-own-utility-stocks/ 
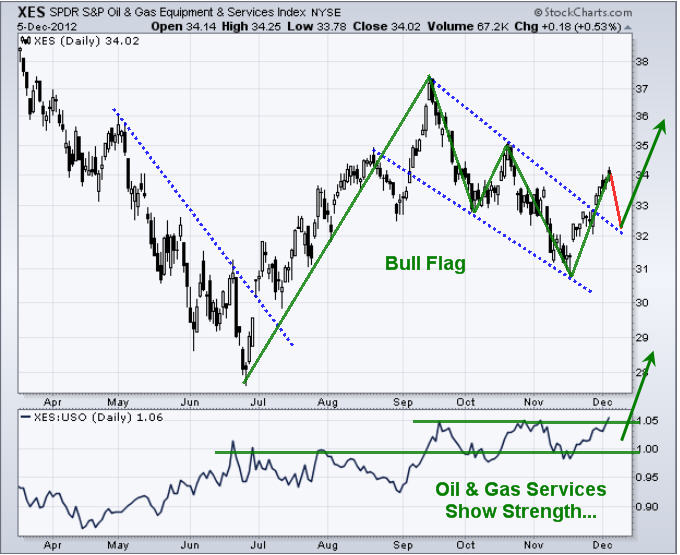
Oil and Gas Services – Daily Time Frame
This chart shows a very bullish picture for the services along with its relative strength to oil (USO) at the bottom. While the sector looks a little overbought here on the short term chart, overall it’s pointing to much higher prices.
Energy Sector Conclusion:
In short, crude oil looks to be trading in a VERY large range without any sign a breakout above or below its channel lines for several months at the minimum. But if the lower channel line is reached and oil starts to trend up then these energy related sector ETFs should post some very large gains and should not be ignored.
- English (UK)
- English (India)
- English (Canada)
- English (Australia)
- English (South Africa)
- English (Philippines)
- English (Nigeria)
- Deutsch
- Español (España)
- Español (México)
- Français
- Italiano
- Nederlands
- Polski
- Português (Portugal)
- Português (Brasil)
- Русский
- Türkçe
- العربية
- Ελληνικά
- Svenska
- Suomi
- עברית
- 日本語
- 한국어
- 简体中文
- 繁體中文
- Bahasa Indonesia
- Bahasa Melayu
- ไทย
- Tiếng Việt
- हिंदी
Energy Sector Storm Brewing – Oil & Gas Stocks
Published 12/07/2012, 01:20 AM
Updated 07/09/2023, 06:31 AM
Energy Sector Storm Brewing – Oil & Gas Stocks
Latest comments
Loading next article…
Install Our App
Risk Disclosure: Trading in financial instruments and/or cryptocurrencies involves high risks including the risk of losing some, or all, of your investment amount, and may not be suitable for all investors. Prices of cryptocurrencies are extremely volatile and may be affected by external factors such as financial, regulatory or political events. Trading on margin increases the financial risks.
Before deciding to trade in financial instrument or cryptocurrencies you should be fully informed of the risks and costs associated with trading the financial markets, carefully consider your investment objectives, level of experience, and risk appetite, and seek professional advice where needed.
Fusion Media would like to remind you that the data contained in this website is not necessarily real-time nor accurate. The data and prices on the website are not necessarily provided by any market or exchange, but may be provided by market makers, and so prices may not be accurate and may differ from the actual price at any given market, meaning prices are indicative and not appropriate for trading purposes. Fusion Media and any provider of the data contained in this website will not accept liability for any loss or damage as a result of your trading, or your reliance on the information contained within this website.
It is prohibited to use, store, reproduce, display, modify, transmit or distribute the data contained in this website without the explicit prior written permission of Fusion Media and/or the data provider. All intellectual property rights are reserved by the providers and/or the exchange providing the data contained in this website.
Fusion Media may be compensated by the advertisers that appear on the website, based on your interaction with the advertisements or advertisers.
© 2007-2025 - Fusion Media Limited. All Rights Reserved.
