
The charts in the energy markets are becoming very interesting. My guess is that the markets will declare themselves for a major move ($15 a barrel in Crude Oil) in the next five to ten trading days. I have no opinion as to which direction the move will be. I have no position as I write this. I expect to be trading energy markets this coming week.
The weekly charts in Crude Oil and Heating Oil show that the energy markets have been congesting for 28 months. Excuse the pun, but the energy markets have been storing a lot of energy. The Crude Oil chart is attempting to complete a massive symmetrical triangle. The market has been trading in the area of the upper boundary of the triangle for the past four weeks.
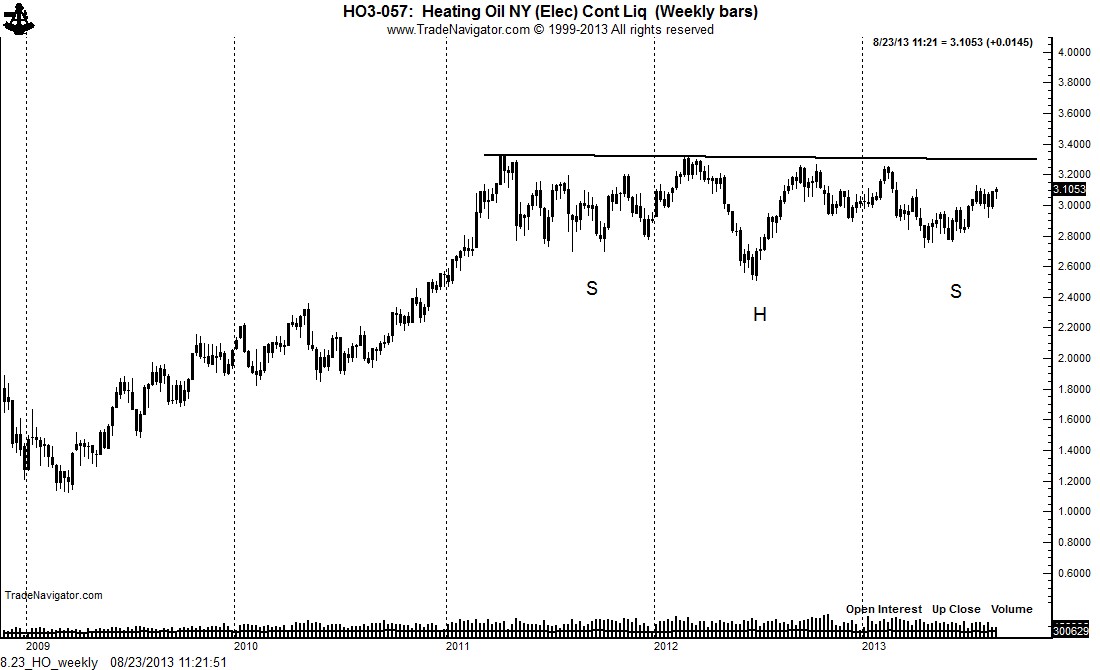
The Heating Oil chart shows a potential continuation H&S bottom pattern. While some Elliott Wave analysts refuse to accept this as a legitimate pattern, the fathers of classical charting — Robert Edward, John Magee and Richard Schabacker — were willing to accept the configuration as such. I have always been amused when Elliott Wave experts attempt to become classical charting experts.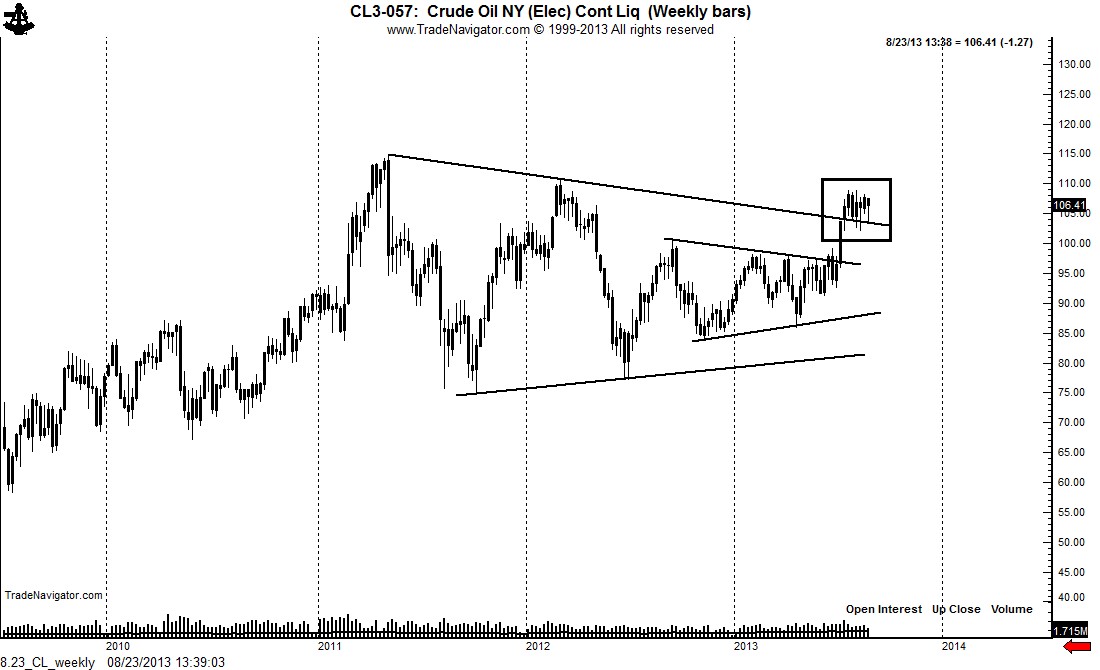
There was another example of a massive continuation H&S pattern in recent years — in Gold. The chart below shows an 18-month continuation leading to the final push in Gold’s historic bull market. The Elliott Wave analyst I had in mind with the above comments mocked me for labeling the weekly Gold chart as a continuation H&S at the time. This analyst, who will remain nameless, was a bear for the subsequent $1,000 per oz. rally in Gold.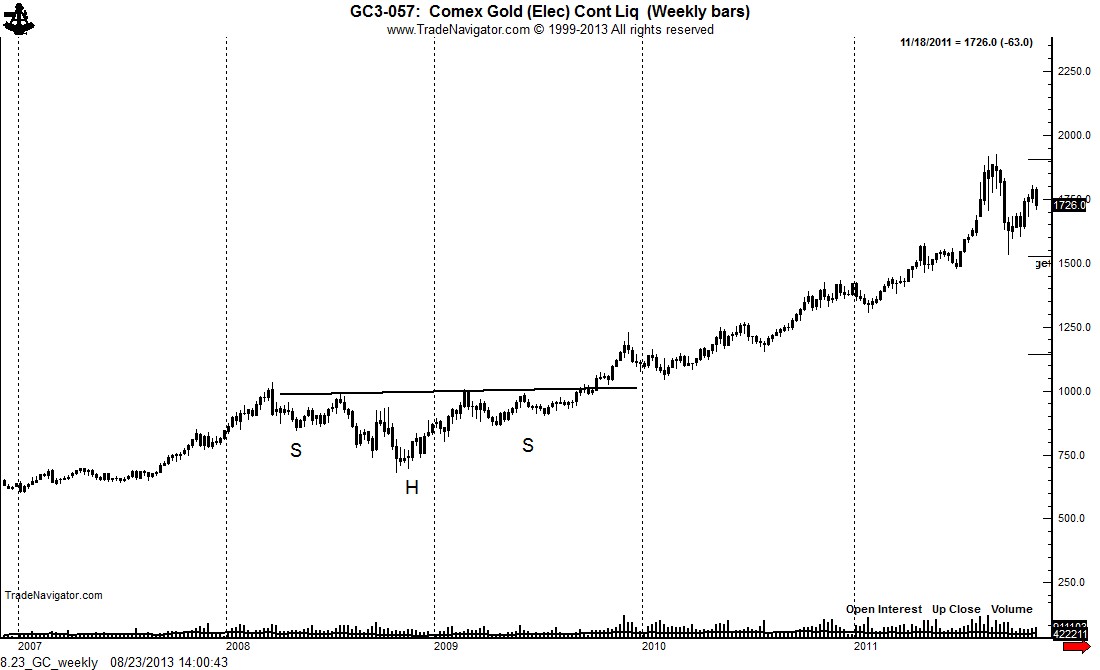
Weekly charts are useful for identifying large patterns. However, daily charts provide the ignition for a launch. The daily Crude Oil chart (continuation) displays a symmetrical triangle. I must comment on the fact that this triangle has six contact points. A six-point symmetrical triangle has the tendency to break out to the upside and then quickly fail. Thus, traders who use this pattern to go long must be very nimble if the market begins to turn down after breaking out.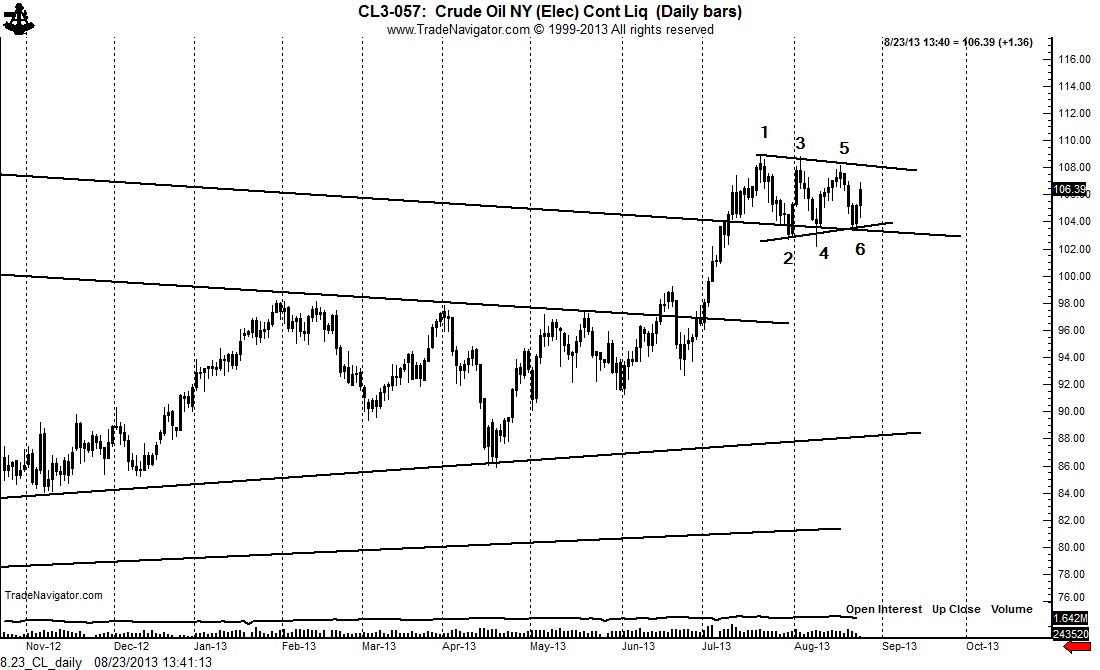
The daily Heating Oil chart displays a small continuation H&S pattern with a very abbreviated right shoulder. Abbreviated right shoulders usually mean one of two things — that more right shoulder development could occur or that the pattern is extremely powerful. Some of the biggest moves I have been involved in over the years came from H&S patterns with abbreviated right shoulders.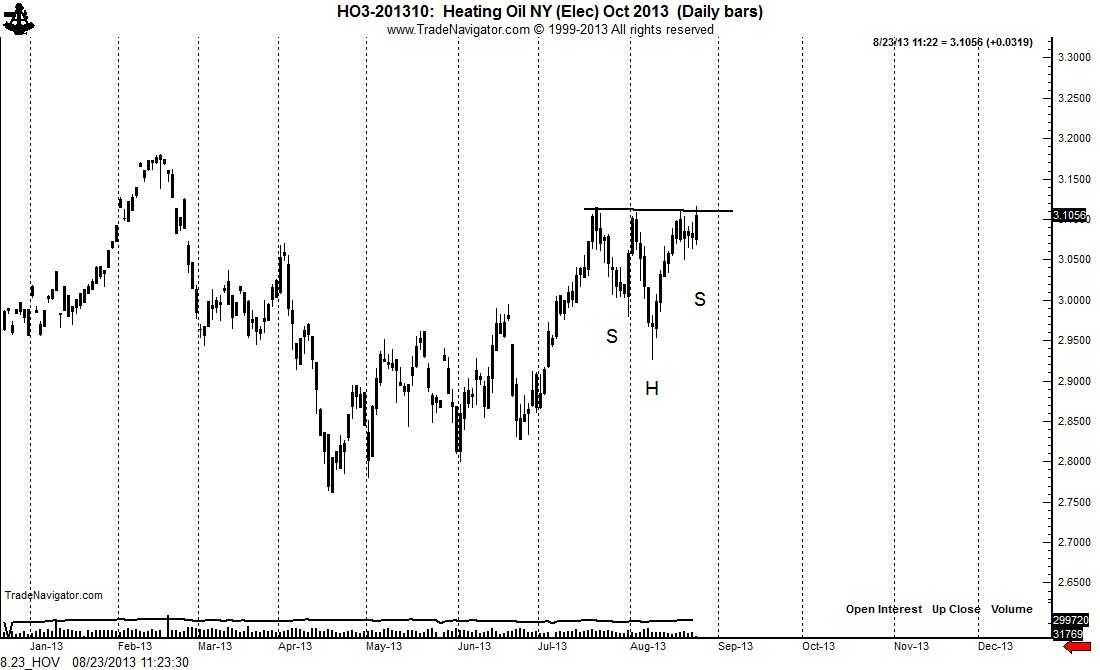
Disclosure: The information in this blog post represents my own opinions and does not contain a recommendation for any particular security or investment. I or my affiliates may hold positions or other interests in securities mentioned in the Blog, please see my Disclaimer page for my full disclaimer.
- English (UK)
- English (India)
- English (Canada)
- English (Australia)
- English (South Africa)
- English (Philippines)
- English (Nigeria)
- Deutsch
- Español (España)
- Español (México)
- Français
- Italiano
- Nederlands
- Português (Portugal)
- Polski
- Português (Brasil)
- Русский
- Türkçe
- العربية
- Ελληνικά
- Svenska
- Suomi
- עברית
- 日本語
- 한국어
- 简体中文
- 繁體中文
- Bahasa Indonesia
- Bahasa Melayu
- ไทย
- Tiếng Việt
- हिंदी
Energy Futures: Major Upside Breakout Or Bull Trap Ahead?
Published 08/25/2013, 12:27 AM
Updated 07/09/2023, 06:31 AM
Energy Futures: Major Upside Breakout Or Bull Trap Ahead?
A major upside breakout or major bull trap? — that is the question!
Latest comments
Loading next article…
Install Our App
Risk Disclosure: Trading in financial instruments and/or cryptocurrencies involves high risks including the risk of losing some, or all, of your investment amount, and may not be suitable for all investors. Prices of cryptocurrencies are extremely volatile and may be affected by external factors such as financial, regulatory or political events. Trading on margin increases the financial risks.
Before deciding to trade in financial instrument or cryptocurrencies you should be fully informed of the risks and costs associated with trading the financial markets, carefully consider your investment objectives, level of experience, and risk appetite, and seek professional advice where needed.
Fusion Media would like to remind you that the data contained in this website is not necessarily real-time nor accurate. The data and prices on the website are not necessarily provided by any market or exchange, but may be provided by market makers, and so prices may not be accurate and may differ from the actual price at any given market, meaning prices are indicative and not appropriate for trading purposes. Fusion Media and any provider of the data contained in this website will not accept liability for any loss or damage as a result of your trading, or your reliance on the information contained within this website.
It is prohibited to use, store, reproduce, display, modify, transmit or distribute the data contained in this website without the explicit prior written permission of Fusion Media and/or the data provider. All intellectual property rights are reserved by the providers and/or the exchange providing the data contained in this website.
Fusion Media may be compensated by the advertisers that appear on the website, based on your interaction with the advertisements or advertisers.
© 2007-2025 - Fusion Media Limited. All Rights Reserved.