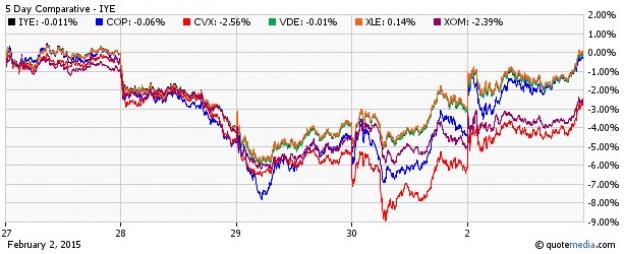
The fourth-quarter results from the big U.S. oil companies like Exxon Mobil (NYSE:XOM), Chevron (NYSE:CVX) and ConocoPhillips (NYSE:COP) are now out. As expected, the oil price collapse took a toll on their profitability, prompting them to cut capital expenses in order to conserve cash balance. This has become the order of the day, especially as the oil price plunge is not showing any sign of respite.
While XOM and CVX beat our earnings estimates, COP missed. On the revenue front, Chevron and ConocoPhillips surpassed our estimates.
Earnings for Big Oil Companies in Focus
The largest U.S. oil company, Exxon Mobil, reported earnings per share of $1.56 that strongly outpaced the Zacks Consensus Estimate of $1.33 but declined substantially from the year-ago earnings of $1.91. Total revenue fell 21.3% year over year to $87.28 billion, well below the Zacks Consensus Estimate of $92.68 billion. As the company’s cash flow in the fourth quarter fell to the lowest level since 2009, Exxon Mobil cut its share repurchase program by 70% to just $1 billion for the ongoing quarter.
Earnings at Chevron, which trails Exxon Mobil, came in at $1.85 per share, strongly outpacing the Zacks Consensus Estimate of $1.67 but deteriorating from the year-ago earnings of $2.57. Revenues dropped 17.9% year over year to $46.09 billion and were much above our estimate of $33.28 billion. Chevron suspended its share buyback program and slashed its capital spending by 13% to $35 billion for this year.
Unlike the other two, the third largest U.S. oil company ConocoPhillips missed the Zacks Consensus Estimate by 2 cents while revenues of $11.85 billion outpaced our estimate of $11.73 billion. However, earnings and revenues were down from $1.40 and $13.99 billion, respectively. This company also followed its rival and cut its capital spending by an additional 15% after reducing it 20% last month.
Market Impact
Despite the shrinking profits and capex cuts, shares of XOM, CVX and COP are up 1.8%, 2.3%, and 5.1%, respectively, over the past three trading sessions. This has also sent energy ETFs in the green territory as well, in particular the funds having large allocations to these big oil giants. Below, we have highlighted some funds that have gained nearly 4% in the same period following the big oil earnings and would be in focus for the coming days.
iShares U.S. Energy ETF (NYSE:IYE)
This ETF tracks the Dow Jones U.S. Oil & Gas Index, giving investors exposure to the broad energy space. The fund holds 93 stocks in its basket with AUM of over $1.1 billion and average daily volume of more than 1 million shares. The product charges 43 bps in fees per year from investors.
Exxon Mobil and Chevron occupy the top two positions in the basket and take the bigger chunk of assets at 22.88% and 11.98%, respectively. ConocoPhillips on the other hand make up for the fourth position at 4.79%. From a sector perspective, oil, gas and consumable fuels make up for nearly 81.3% share while oil equipment & services takes 17.7% share.
Vanguard Energy ETF (NYSE:VDE)
This fund manages nearly $3.3 billion asset base and provides exposure to a basket of 164 energy stocks by tracking the MSCI US Investable Market Energy 25/50 Index. The product sees a solid volume of more than 475,000 shares and charges 12 bps in annual fees (read: Sector ETFs to Avoid for Q4 Earnings Season).
Exxon and Chevron are the top two firms with 22.7% and 12.1% allocation, respectively, while COP is the fourth firm making up for 4.8% share. Though the product is skewed toward the integrated oil & gas sector with 39.7% of assets, exploration and production, and equipment services provide a nice mix in the portfolio with double-digit exposure.
Energy Select Sector SPDR (ARCA:XLE)
This is the largest and most popular ETF in the energy space with AUM of $11.7 billion and average daily volume of 24.5 million shares per day. Expense ratio came in at 0.15%. The fund follows the S&P Energy Select Sector Index and holds 45 securities in its basket.
Here again, XOM and CVX occupy the top two spots with 16.48% and 13.056% share, respectively, while COP takes the sixth spot at 3.78%. In terms of industrial exposure, oil, gas & consumable fuels accounts for nearly 81.7% of the portfolio while energy equipment & services takes the remainder.
Will This Trend Continue?
These gains seem to be short-lived given that the biggest strike since 1980 at nine refineries in the U.S. will likely curtail crude processing adding to the global supply glut. This will likely push oil prices and energy stocks down.
Currently, 10% of the U.S. refining capacity has been affected and if the strike turns to a full-blown crisis, it could threaten about two-thirds of the total refining capacity, indicating more pain for the commodity and the energy stocks. Added to the woes is the fact that the three in-focus stocks have an unfavorable Zacks Rank of #5 (Strong Sell) and fall in the bad industry category with the Zacks Industry Rank in the bottom 3% or 4%. This underscores the pessimistic outlook for the overall energy space at least for the near term.
