There have been several posts over the past few weeks discussing college / university education. Goldman Sachs economist Jan Hatzius stated:
[T]he faster job growth among college graduates is entirely due to faster growth in the size of the college-educated population; the employment/population ratio among college graduates has in fact fallen sharply,
Here is a graph showing the relative growth of employment of college / university graduates (blue line) and high school dropouts (red line).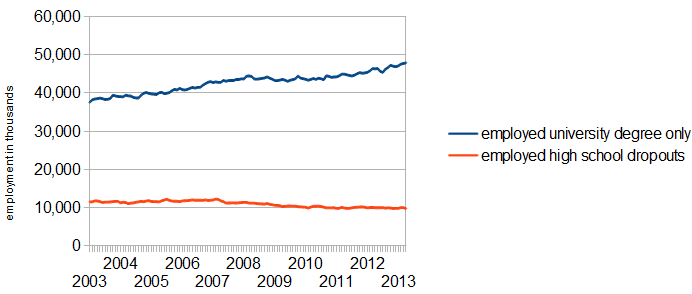
This post was accompanied by the the following graphic showing the differentials in the employment – population ratio.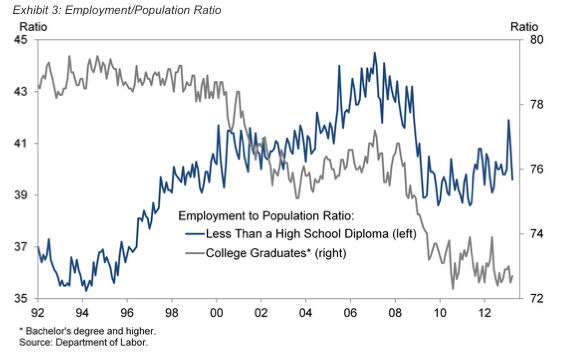
This discussion needs additional context as the implication is that lower educated people’s lot in life is improving, while higher educated people’s potential is declining. Before going too far, be sure to note that 76% of college graduates are employed (compared to 58%+ for the total population), while the ratio for high school dropouts is just below 40%.
Whilst I am a lover of employment – population ratios to understand the jobs situation, one must be very careful when segregating these ratios into groups – as the groups themselves are changing in relative size. Another problem with using high school dropouts as a comparable group is that many dropouts are minimum wage earners (or worse). Should you encourage your kid to drop out of high school? A real comparison would be between high school graduates with no further education and college / university graduates with undergraduate degrees only.
Change in Population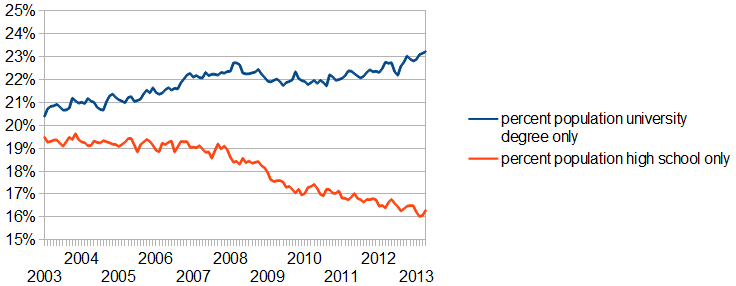
Here one can understand these two groups were relatively similar in size in 2003, but currently the group of college / university graduates is now over 40% larger. This distorts the view of the employment – population ratios if one group is growing much faster than another group. And when one looks at the employment levels of the various groups the dynamics become even more apparent.
Change in Employment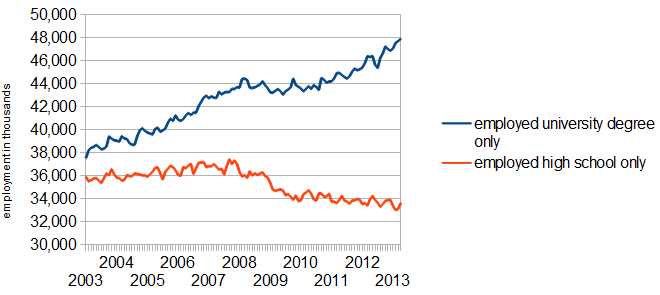
Employment (in real terms) has contracted for high school graduates since 2003, and trending up for university graduates.
I have never been a fan of believing a university education is the only key to financial success. Post high school education depends on the individual and opportunities. Many motivated youth could be better served by trade school and/or self-employment as opposed to building a student loan debt which will eat away any differential in potential earnings. But it is wrong to convey there is a general problem in employment for those with higher education. Clearly lower educated people make less money, and have significantly less job opportunities as they lack skills in general.
I does appear that one truth is evident – that business is not providing a job to all college / university graduates. Just getting any old degree may not be enough to get a job; it is becoming more important to get a degree that related to job at hand.
Other Economic News this Week:
The Econintersect economic forecast for May 2012 declined marginally, but remains in a zone which says the economy is beginning to grow normally. There are some warning signs that our interpretation is not correct – but we will see how these play out in the coming months.
The ECRI WLI growth index value has been weakly in positive territory for over four months – but in a noticeable improvement trend. The index is indicating the economy six month from today will be slightly better than it is today.
Current ECRI WLI Growth Index 
Initial unemployment claims rose from 323,000 (reported last week) to 360,000 this week. Historically, claims exceeding 400,000 per week usually occur when employment gains are less than the workforce growth, resulting in an increasing unemployment rate (background here and here).
The real gauge – the 4 week moving average – modestly degraded from 336,750 (reported last week) to 339,250. Because of the noise (week-to-week movements from abnormal events AND the backward revisions to previous weeks releases), the 4-week average remains the reliable gauge.
Weekly Initial Unemployment Claims – 4 Week Average – Seasonally Adjusted – 2011 (red line), 2012 (green line), 2013 (blue line) 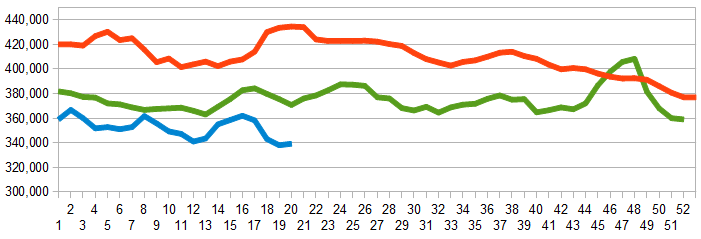
Bankruptcies this Week: SBM Certificate, Skinny Nutritional
Data released this week which contained economically intuitive components (forward looking) were:
- Rail movements are beginning to show a modest growth trend.
Weekly Economic Release Scorecard:
Click here to view the scorecard table below with active hyperlinks

