Note from dshort: The Empire State Manufacturing Survey is not an indicator I routinely follow. But the government shutdown has delayed the October 17th release of the Federal Reserve's Industrial Production and Capacity Utilization report -- one that I follow closely. As a result, I'm extending my boundaries in searching for clues about the economy.
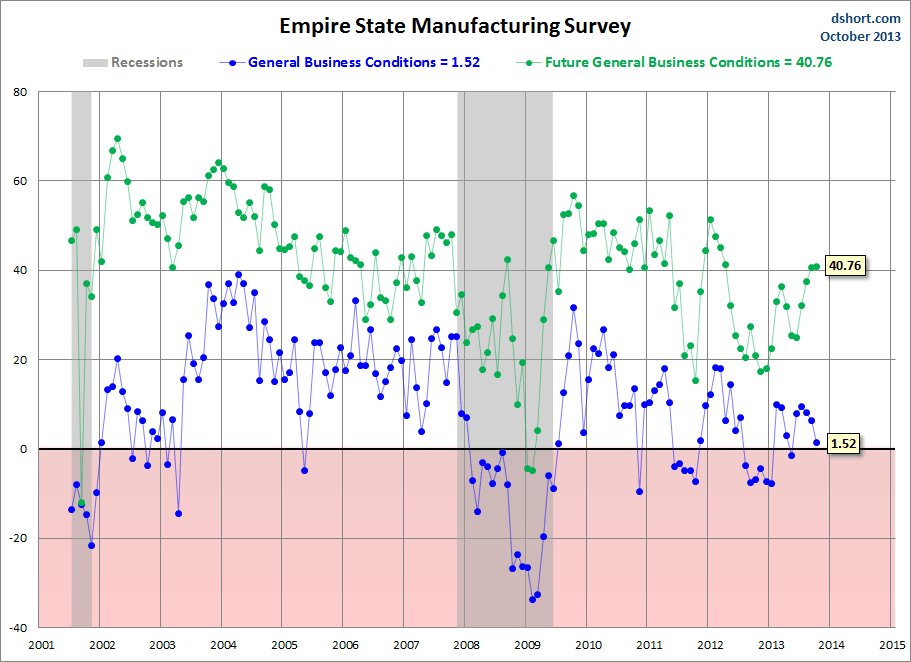
This morning we got the latest Empire State Manufacturing Survey. The diffusion index for General Business Conditions disappointed expectations, posting a weak expansionary reading of 1.52, down from 6.29 last month. This is the lowest reading since the contractionary -1.43 in May. The Investing.com forecast was for 7.0. As Investing.com points out, "The Empire State Manufacturing Index rates the relative level of general business conditions New York state. A level above 0.0 indicates improving conditions, below indicates worsening conditions. The reading is compiled from a survey of about 200 manufacturers in New York state."
Here is the opening paragraph from the report:
The October 2013 Empire State Manufacturing Survey indicates that business conditions held steady for New York manufacturers. The general business conditions index fell 5 points to 1.5. The new orders index rose five points to 7.8 and the shipments index fell three points to 13.1, suggesting that both orders and shipments increased modestly over the month. The prices paid index was unchanged at 21.7 and the prices received index fell six points to 2.4. Labor market conditions were also steady, with the index for number of employees falling four points to 3.6 and the average workweek index inching up to 3.6. Indexes for the six-month outlook continued to convey a strong degree of optimism about future business conditions.
Here is a chart illustrating both the General Business Conditions and Future General Business Conditions (the outlook six months ahead):
Click this link to access a PDF set of charts of the individual components over the past 12 months.
Since this survey only goes back to July of 2001, we only have one complete business cycle with which to evaluate its usefulness as an indicator for the broader economy. Following the Great Recession, the index has slipped into contraction four times, the most recent being the one-month decline in May. However the expansionary interim highs since the post-recession peak in October 2009 have gotten successively smaller, which is indicative of a generally slowing regional economy.
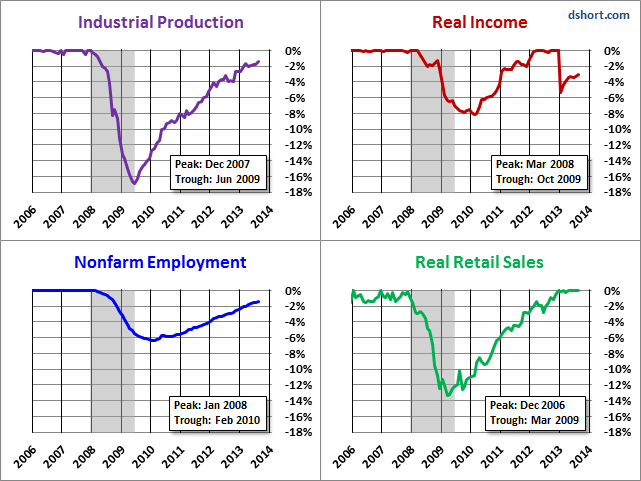
The Empire State Survey is focused on manufacturing, so it's only a subset (albeit a very large one) of the Federal Reserve's Industrial Production Index, which covers manufacturing, mining, and electric and gas utilities. See the upper left corner in the four-pack below. Note that this four-pack illustrates the percent off the all-time high.
Ordinarily I would be updating the Big Four with the latest Industrial Production data and Real Retail Sales (lower right chart, which requires the Consumer Price Index to calculate). But, thanks to our dysfunctional congress, we have a government shutdown ... hence no industrial production data, no retail sales data and no read on inflation. 
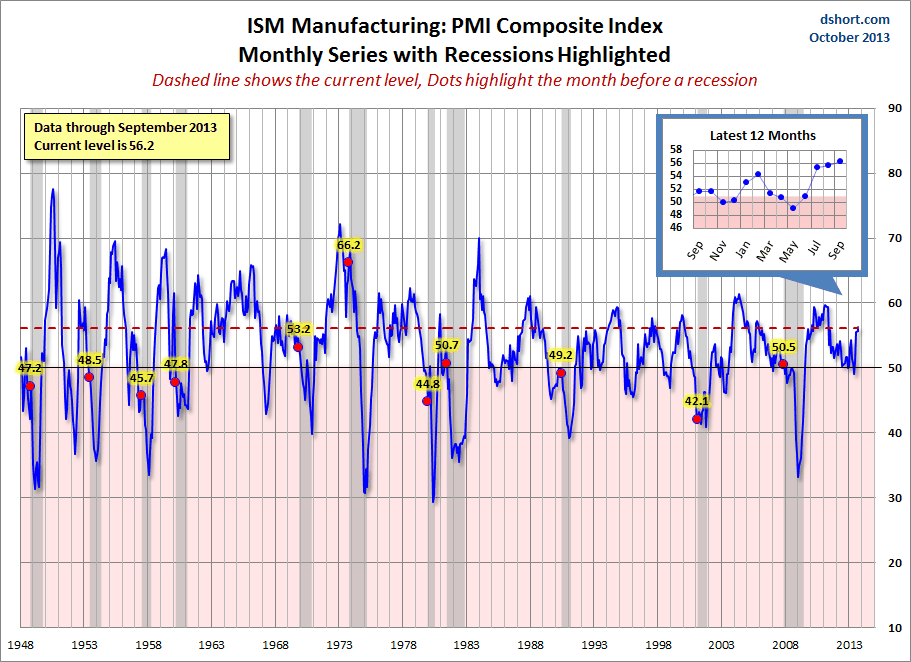
Meanwhile, here's another look at the latest ISM Manufacturing Business Activity Index.
I'll keep a close eye on some of the regional manufacturing indicators in the months ahead.
- English (UK)
- English (India)
- English (Canada)
- English (Australia)
- English (South Africa)
- English (Philippines)
- English (Nigeria)
- Deutsch
- Español (España)
- Español (México)
- Français
- Italiano
- Nederlands
- Português (Portugal)
- Polski
- Português (Brasil)
- Русский
- Türkçe
- العربية
- Ελληνικά
- Svenska
- Suomi
- עברית
- 日本語
- 한국어
- 简体中文
- 繁體中文
- Bahasa Indonesia
- Bahasa Melayu
- ไทย
- Tiếng Việt
- हिंदी
Empire State Manufacturing: Lowest Since May
Published 10/15/2013, 09:53 AM
Updated 07/09/2023, 06:31 AM
Empire State Manufacturing: Lowest Since May
Latest comments
Loading next article…
Install Our App
Risk Disclosure: Trading in financial instruments and/or cryptocurrencies involves high risks including the risk of losing some, or all, of your investment amount, and may not be suitable for all investors. Prices of cryptocurrencies are extremely volatile and may be affected by external factors such as financial, regulatory or political events. Trading on margin increases the financial risks.
Before deciding to trade in financial instrument or cryptocurrencies you should be fully informed of the risks and costs associated with trading the financial markets, carefully consider your investment objectives, level of experience, and risk appetite, and seek professional advice where needed.
Fusion Media would like to remind you that the data contained in this website is not necessarily real-time nor accurate. The data and prices on the website are not necessarily provided by any market or exchange, but may be provided by market makers, and so prices may not be accurate and may differ from the actual price at any given market, meaning prices are indicative and not appropriate for trading purposes. Fusion Media and any provider of the data contained in this website will not accept liability for any loss or damage as a result of your trading, or your reliance on the information contained within this website.
It is prohibited to use, store, reproduce, display, modify, transmit or distribute the data contained in this website without the explicit prior written permission of Fusion Media and/or the data provider. All intellectual property rights are reserved by the providers and/or the exchange providing the data contained in this website.
Fusion Media may be compensated by the advertisers that appear on the website, based on your interaction with the advertisements or advertisers.
© 2007-2025 - Fusion Media Limited. All Rights Reserved.
