Taking a deeper look at the massive $1T U.S. market opportunity for AVs
The E-mini yesterday broke above last week’s high and reached the 3400 Big Round Number. While traders expect the 2-week wedge rally to test the September 16 lower high this week, they also expect a reversal down from between 3400 and 3500. The reversal can come at any time, but the bears want a good sell signal bar on the daily chart. It is possible that the September trading range continues up to the US presidential election before there is a breakout up or down.
The bulls obviously want a successful breakout above the 5-week trading range and a measured move up to a new high. They have a 40% chance of achieving their goal. A strong breakout above the September 16 lower high would shift the probability in favor of a new all-time high.
Most recent days have had a lot of trading range price action. That is what typically happens when the market is in a trading range on the daily chart, like over the past 5 weeks. Day traders will expect more of it today, despite yesterday’s rally. However, the September 16 lower high is a magnet above, so traders expect at least slightly higher prices.
Overnight Emini Globex Trading
The Emini is up 8 points in the Globex session. Since traders expect a test of the September 16 high of 3419.50 and the Emini has been rallying for 3 weeks, there is a bullish bias to the market this week.
That high is only 13 points above today’s current Globex high. The Emini could easily get there today.
On the 60 minute chart, there is another lower high at 3474. That is why I have been saying that the sell zone might be up to 3500. However, there were several lower highs below that and the Emini will probably begin to go sideways in this resistance zone. That will increase the chance of more trading range trading on the 5 minute chart.
Since there is a magnet at 3474 and the Emini has been rallying, there is an increased chance of a big bull trend day this week. Traders might conclude that the Emini is going to test 3474 – 3500. If enough do, the Emini could rally strongly for a couple days and get there. However, it is more likely that the Emini will start to go sideways today or tomorrow.
Yesterday’s Setups

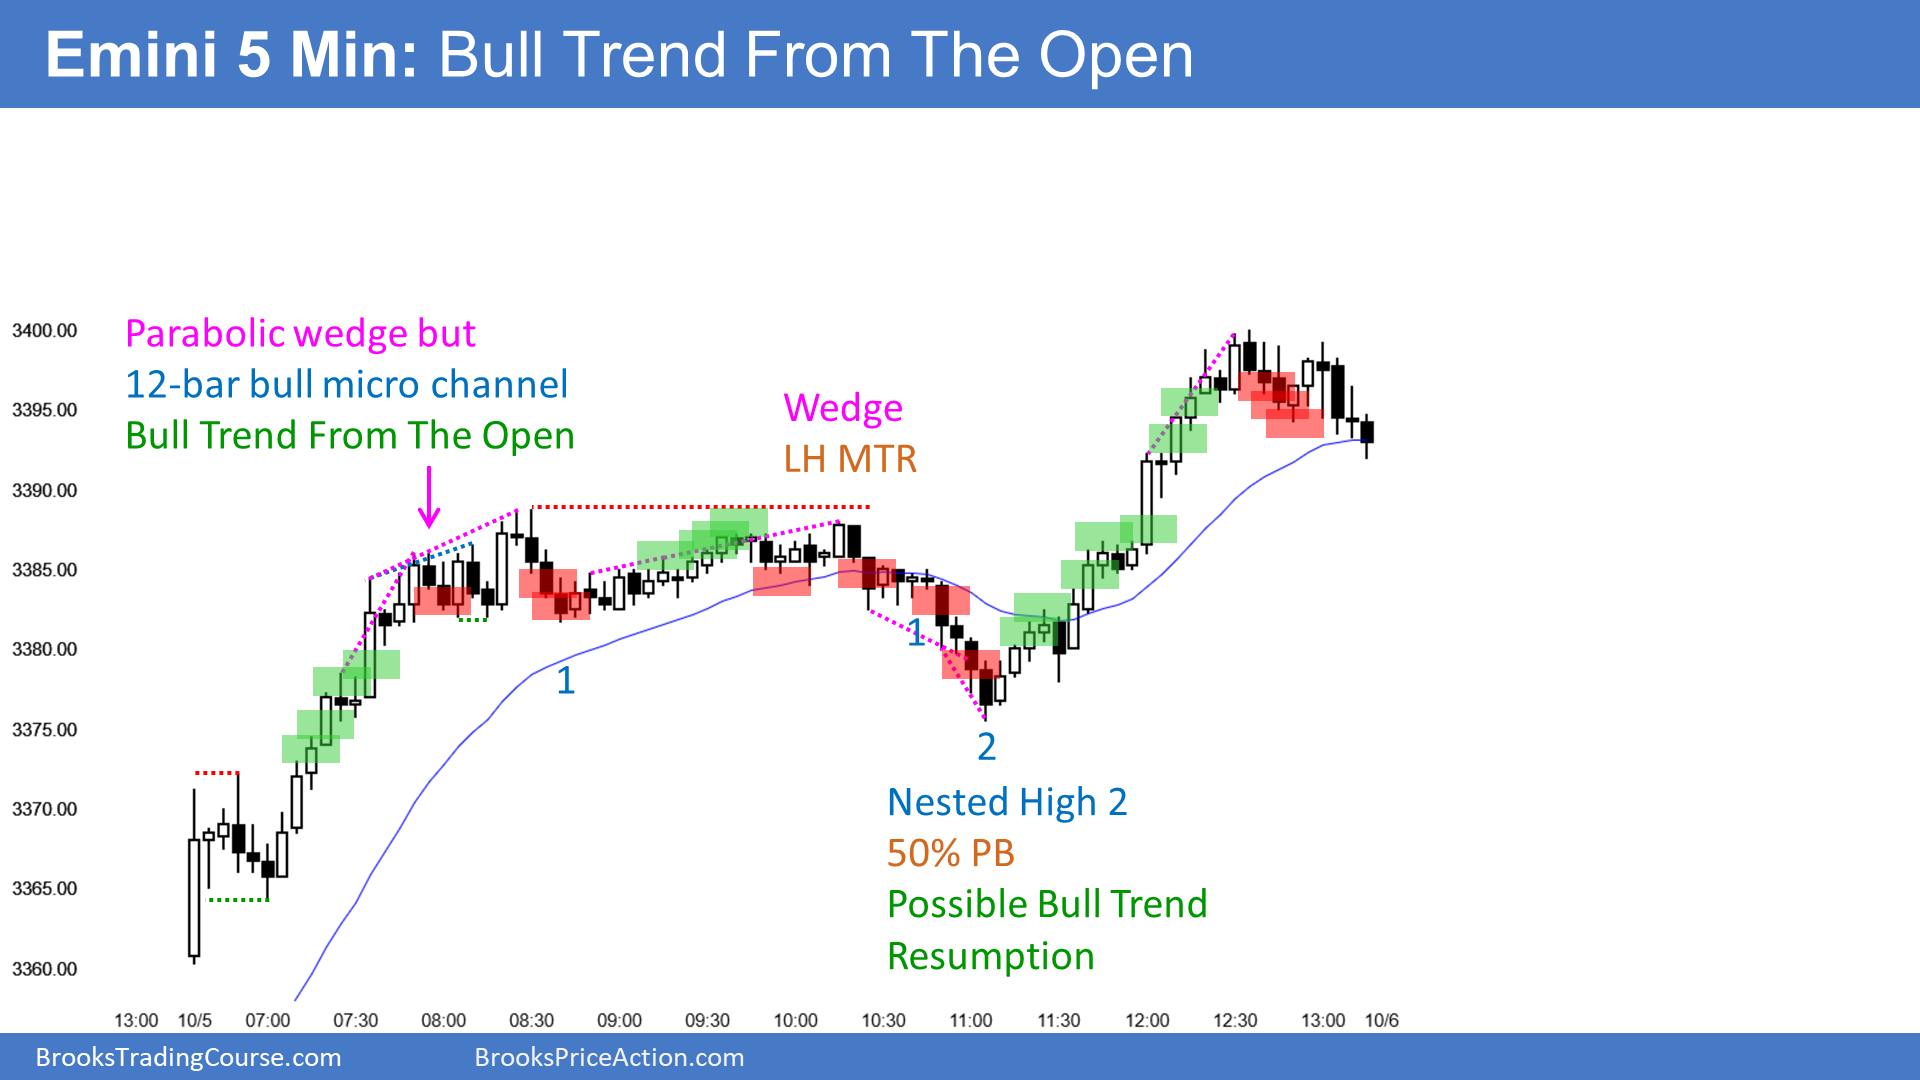
Here are several reasonable stop entry setups from yesterday. I show each buy entry with a green rectangle and each sell entry with a red rectangle. I rarely also show limit order entries and entries on the close of bars. I do not want the lines to be distracting. If they are longer, I make them dotted. But, they have to be visible, so I make the shorter ones solid. Buyers of both the Brooks Trading Course and Encyclopedia of Chart Patterns have access to a much more detailed explanation of the swing trades for each day (see Online Course/BTC Daily Setups).
My goal with these charts is to present an Always In perspective. If a trader was trying to be Always In or nearly Always In a position all day, and he was not currently in the market, these entries would be logical times for him to enter.
If the risk is too big for your account, you should wait for trades with less risk or trade an alternative market like the Micro Emini.
