Pre-Open Market Analysis
The Emini triggered a double bottom buy signal on Friday. However, the buy signal bar was a small bear doji. That is an unreliable setup. Furthermore, it followed a huge selloff on the day before and the Emini has been in a trading range for 2 weeks. Traders are therefore not looking for a big reversal up. More likely, the rally will end this week and the 3-week trading range will continue.
Even though the Emini has been sideways, the August selloff was surprisingly strong. Traders should expect a test below 2800 within a few weeks. This is true even if this rally tests to just below the all-time high.
Overnight Emini Globex Trading
The Emini is up 31 points in the Globex session. Last Tuesday, there was a huge rally on the 5-minute chart on the open. A Bull Major Surprise like that usually affects the market for many days and sometimes weeks.The selloff from that rally was deep and the Emini fell far below the low of that day. However, a selloff from a Bull Major Surprise typically results in a trading range and not a bear trend. The 2-day rally is now a bull leg in that trading range. At a minimum, it should test last Tuesday’s high.Is the rally a resumption of the June/July bull trend? Probably not. The August selloff was a Bear Major Surprise on the daily chart. The odds still favor at least a brief selloff to below the August low.However, there is room to last week’s double top at around 2950. That is a magnet above. There is therefore an increased chance of rally today or tomorrow up to that resistance.Whenever there is an increased chance of a bull trend day, there is also an increased chance of the opposite. If there is an early strong selloff, day traders will be ready to swing trade their shorts.
Friday’s Setups

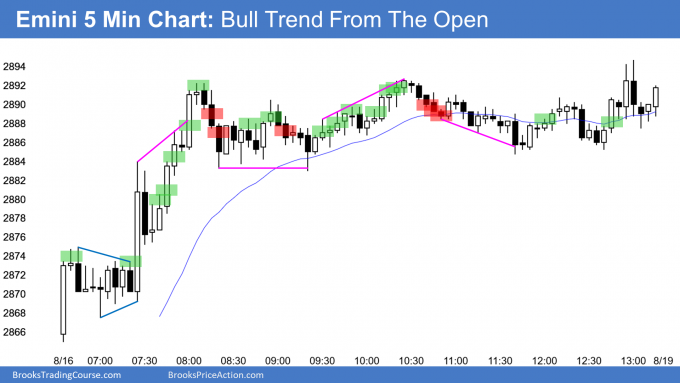
Here are several reasonable stop entry setups from Friday. I show each buy entry with a green rectangle and each sell entry with a red rectangle. I rarely also show limit order entries and entries on the close of bars. Buyers of the Brooks Trading Course and Encyclopedia of Chart Patterns have access to a much more detailed explanation of the swing trades for each day.
My goal with these charts is to present an Always In perspective. If a trader was trying to be Always In or nearly Always In a position all day, and he was not currently in the market, these entries would be logical times for him to enter.
