The Emini reversed down from a nested wedge top on the daily chart a week ago. However, this week rallied strongly and it is testing the top of the wedge. It will probably trigger the buy signal on the monthly chart before there is a pullback to 2600. The near-term upside is probably to 3,000 to 3,100.
The bond futures market has been in a tight trading range for 9 weeks. There is no sign that this is about to change. It is more likely to test the January low than the March high over the next few months.
The EUR/USD Forex market has been sideways for 4 weeks. It is in Breakout Mode. Traders are looking for small reversals until there is a strong breakout.
30 year Treasury bond Futures market:
Small double top in tight trading range
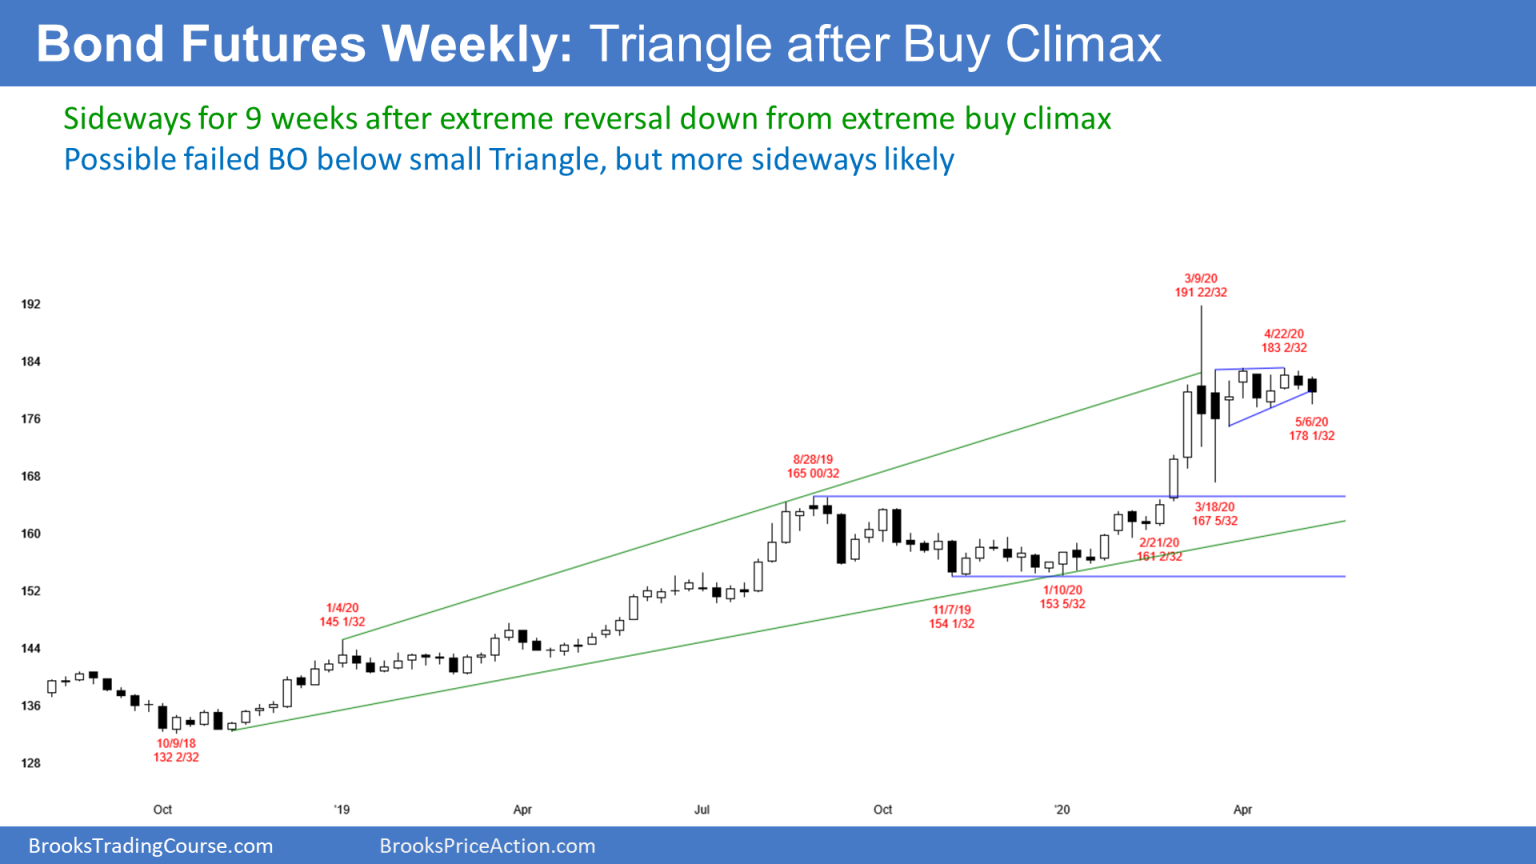
The 30 year Treasury bond futures has been sideways for 9 weeks on the weekly chart. The March 9 buy climax was the most extreme in history. It is a good candidate for the end of the 30 year bull trend.
However, when a bull trend ends, especially an extremely strong one, what follows is typically a trading range. And it can last for several years.
At some point, the bond market will begin a bear trend for a decade. That is more likely than the bull trend resuming much above the March high.
This week turned down from a micro double top with the April 3 high. This is a double top lower high major trend reversal. It could be the start of a 10 year bear trend. With the prominent tail below this week’s candlestick, it is more likely that the tight trading range will continue for at least another week.
If the next several weeks are big bear bars closing on their lows, there would be a 60% chance that this lower high will hold for many years. But if there is weak follow-through selling, traders will assume that the 9 week trading range will continue. If it does, there will probably be at least a brief breakout above this double top at some point.
Where are the boundaries of a trading range?
Trading ranges usually contain smaller trading ranges. The past 9 weeks have been in a tight range. This week might be the start of a breakout below that range. If so, this will probably lead to a bigger trading range.
For example, the selloff might test the March 18 low. The bond futures reversed up violently from that low. Traders expect that there will be buyers around that price again. Therefore, there might be a double bottom there. That would then be the bottom of a bigger trading range. The March high should remain as the top of that bigger range.
2019 Final Bull Flag
I said that the bottom of the range would be around the March low. I was intentionally vague. It is more likely that the bond futures will fall below that price. Why? Because when markets are in trading ranges and they are near support or resistance, they tend to exceed it before reversing.
The March low was a test of the August 28 high. That was the breakout point for the January to March buy climax. Legs in trading ranges usually pull back beyond breakout points, which are also support. Consequently, the bottom of the range will probably be below that high.
Final Bull Flag in late 2019
In late 2019, I said that the August-December trading range was tight and late in a bull trend. I wrote that it was a good candidate for the Final Bull Flag.
At the time, I said that traders should expect a bull breakout, but that the breakout would likely be a final buy climax. I talked about how a Final Bull Flag is a magnet and that traders should expect the buy climax to start a reversal down to the bottom of the flag. That is the November low.
It could take a long time to get there. However, there is a 70% chance that the bonds will trade back to that Final Bull Flag within a year or two.
No negative interest rates
The President has said several times that he wants negative interest rates. If that were to happen, the bond market would probably go above the March high.
However, the American public expects to receive interest on their savings accounts. They do not want to pay a bank interest on their savings accounts. That is an obvious negative side effect of negative interest rates.
Furthermore, seniors want inflation. Many depend on interest on savings accounts and money market accounts. If we had negative interest rates, tens of millions of seniors and their families would be outraged. It therefore will not happen. That makes it unlikely that the bond market will get much above the March high. In fact, the odds are that March will be the high for at least a decade.
What about next week?
Although this week was a bear bar, it did not break strongly below the 9 week range. In addition, it had a prominent tail below. It is therefore still only a leg in that range. Also, the bar on the weekly chart was not particularly big. That reduces the chance that it will be the start of a bear trend.
This week is currently testing the bottom of the 9 week range. Nothing is clear in trading ranges. Remember, a trading range exists because the bulls and bear are balanced. That makes it difficult for one side to dominate for very long. Traders therefore expect bad follow-through after strong bars. Reversals are more likely than trends.
However, there are magnets below. After 9 sideways weeks, traders expect the bond market to get to the 20 week EMA within a few weeks. It can get there by going sideways or down.
In addition, April had a tiny range. May is within the April range. This selloff should fall below the April low. Since April was a bull doji candlestick on the monthly chart (not shown), it is a weak sell signal bar. That means that there will probably be buyers not far below the April low.
Bonds are probably working lower
Over the next few weeks, the bond futures market will probably be sideways to down. At some point over the next year it should continue down to the bottom of the most recent buy climax. That is the January low. Then, within 1 – 3 years, it should get down to the August-December 2019 Final Bull Flag.
Now what about Trump’s negative interest rates? The chart says that the institutions do not believe they will happen.
Buffet says no default
As a side note, Warren Buffet this week said something interesting that I have said a few times over the past many years. When the U.S. sells bonds, people and other governments pay dollars to buy them. When our government buys them back, the government pays in dollars.
Because the Treasury decides how many dollars they want to print, we can never default on our debt, not matter how big it gets. We can simply print infinite money and pay off any debt.
But there is a side effect to everything. Countries who bought our bonds would effectively see that as effectively a default, even though it is not an actual default. It is a default in the sense that we did not live up to our promise of doing everything possible to keep their money safe.
If there are so many dollars that they are now worthless, any country who bought our bonds would be holding worthless bonds. Our dollars would not be able to buy anything from anyone. TVs, phones, French wine, German cars, shirts, shoes… forget all of it. Our quality of life would deteriorate horribly. We would be a poor country.
But, that is our unspoken back-up plan to guarantee that we will never default.
Full faith and credit
People who buy our bonds rely on our full faith and credit. They know we will pay them when the bonds mature. They understand that we will cheat if we have to and print infinite money, but there is less chance with our bonds than with those from any other country. Because the world trusts us, we get to sell bond in dollars and at low interest rates.
It is important to note that this is different from many other countries. For example, if Argentina, Venezuela, or Iran have inflation rates of 1,000 to 1,000,000% and it wants to sell bonds, no one would buy their bonds if those bonds were issued in their own currencies. Those countries would have to sell them in dollars and pay high interest rates because of the significant risk of default.
It is critically important that we remain trustworthy. This will allow us to always sell bonds in dollars and therefore never have to worry about defaulting.
EUR/USD weekly Forex chart:
Tight trading range, but bear channel
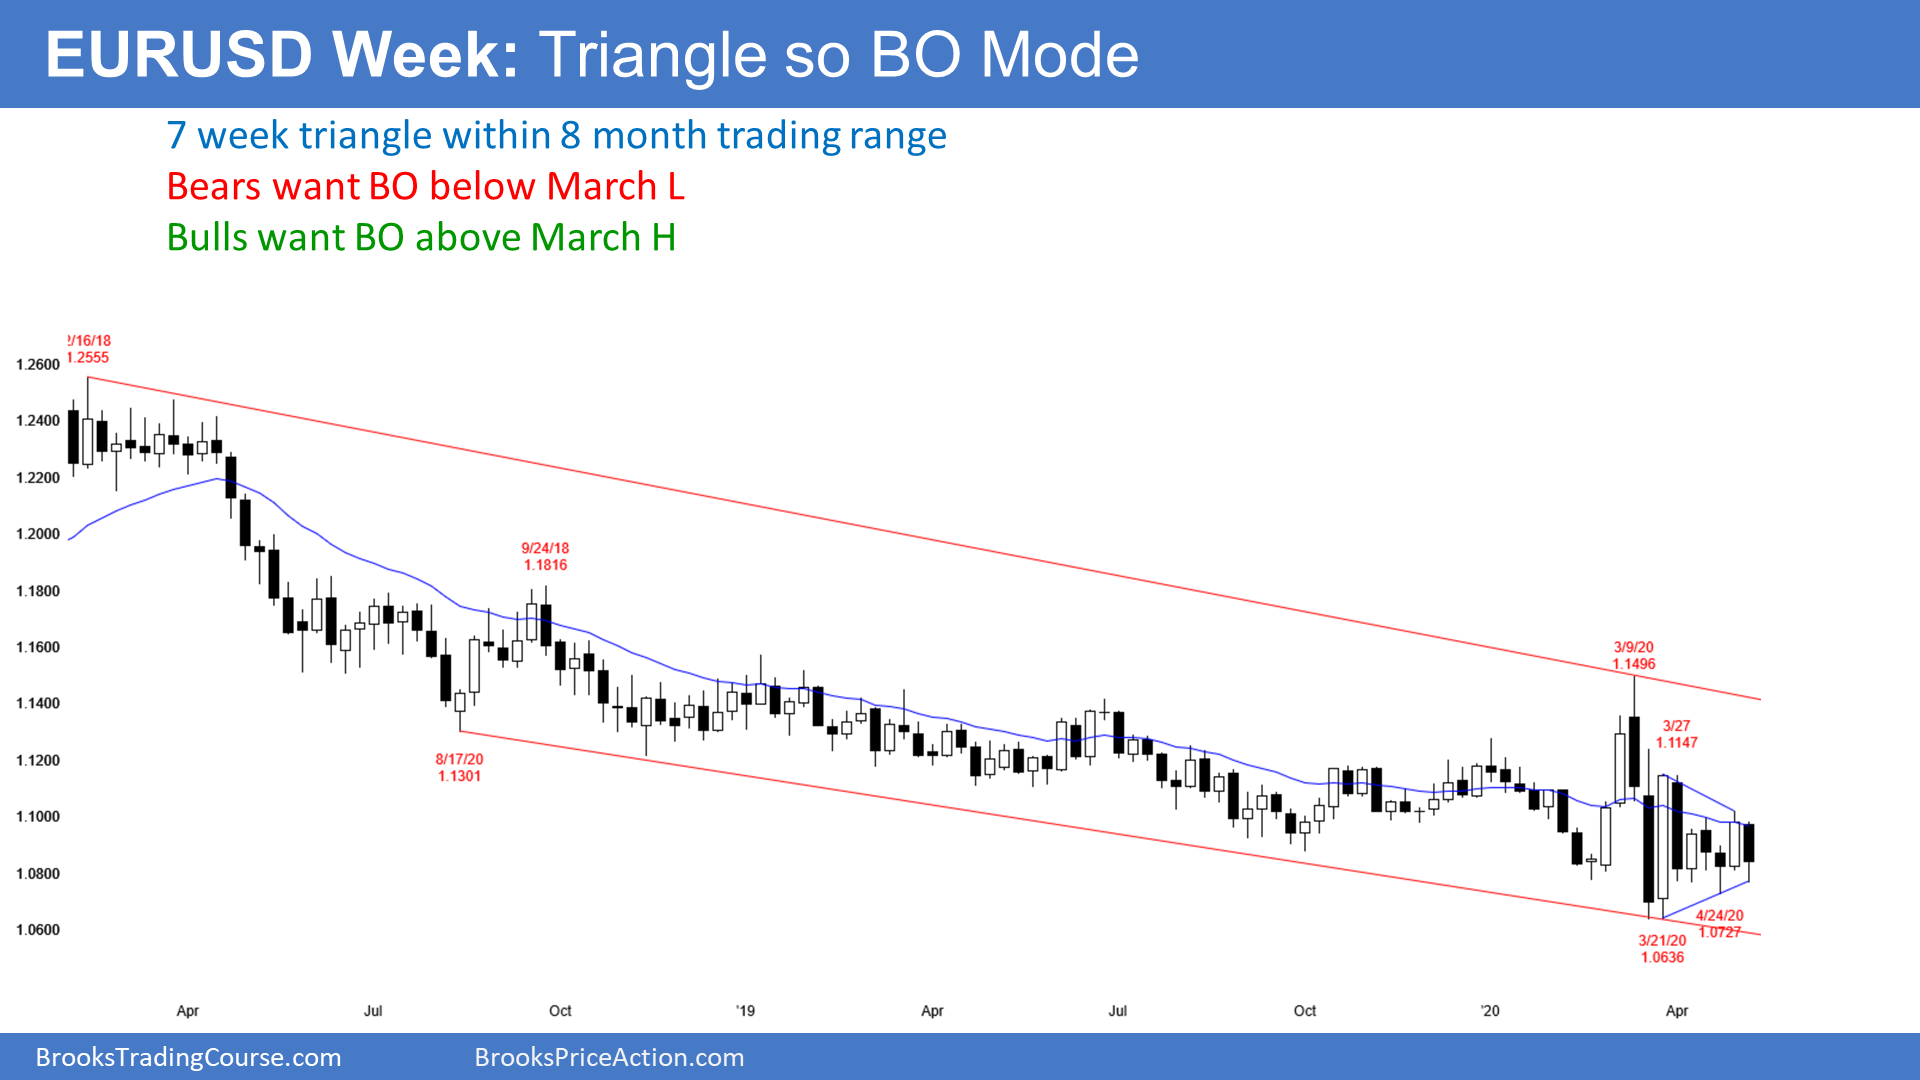
The EUR/USD weekly Forex chart has been in a tight trading range for 5 weeks. It is nested within a 9 month trading range. Traders are continuing to look for reversals.
It is now in the bottom half of the range. There will probably be a bounce for a few days next week. With the range as tight as it has been, the legs up and down are lasting only a week. For the past 2 years, legs up and down went 2 – 4 weeks before reversing.
The weekly chart is in Breakout Mode. It is reasonable to call it a 7 week triangle. When any market is in Breakout Mode, there is always both a reasonable buy and sell setup. Here, the bears have a double top with the April 15 and May 1 highs. There is a head and shoulders bottom on the daily chart (not shown) that began with the April 6 low. Since most breakout attempts fail, the buy and sell patterns keep failing and new ones replace the old ones.
A clear breakout means consecutive closes beyond the range. The breakout is more likely to be successful if there are consecutive big trend bars closing on the extreme. This is true for both bull and bear breakouts. Without that, traders will expect every breakout attempt to reverse.
Monthly chart in 2 year bear channel
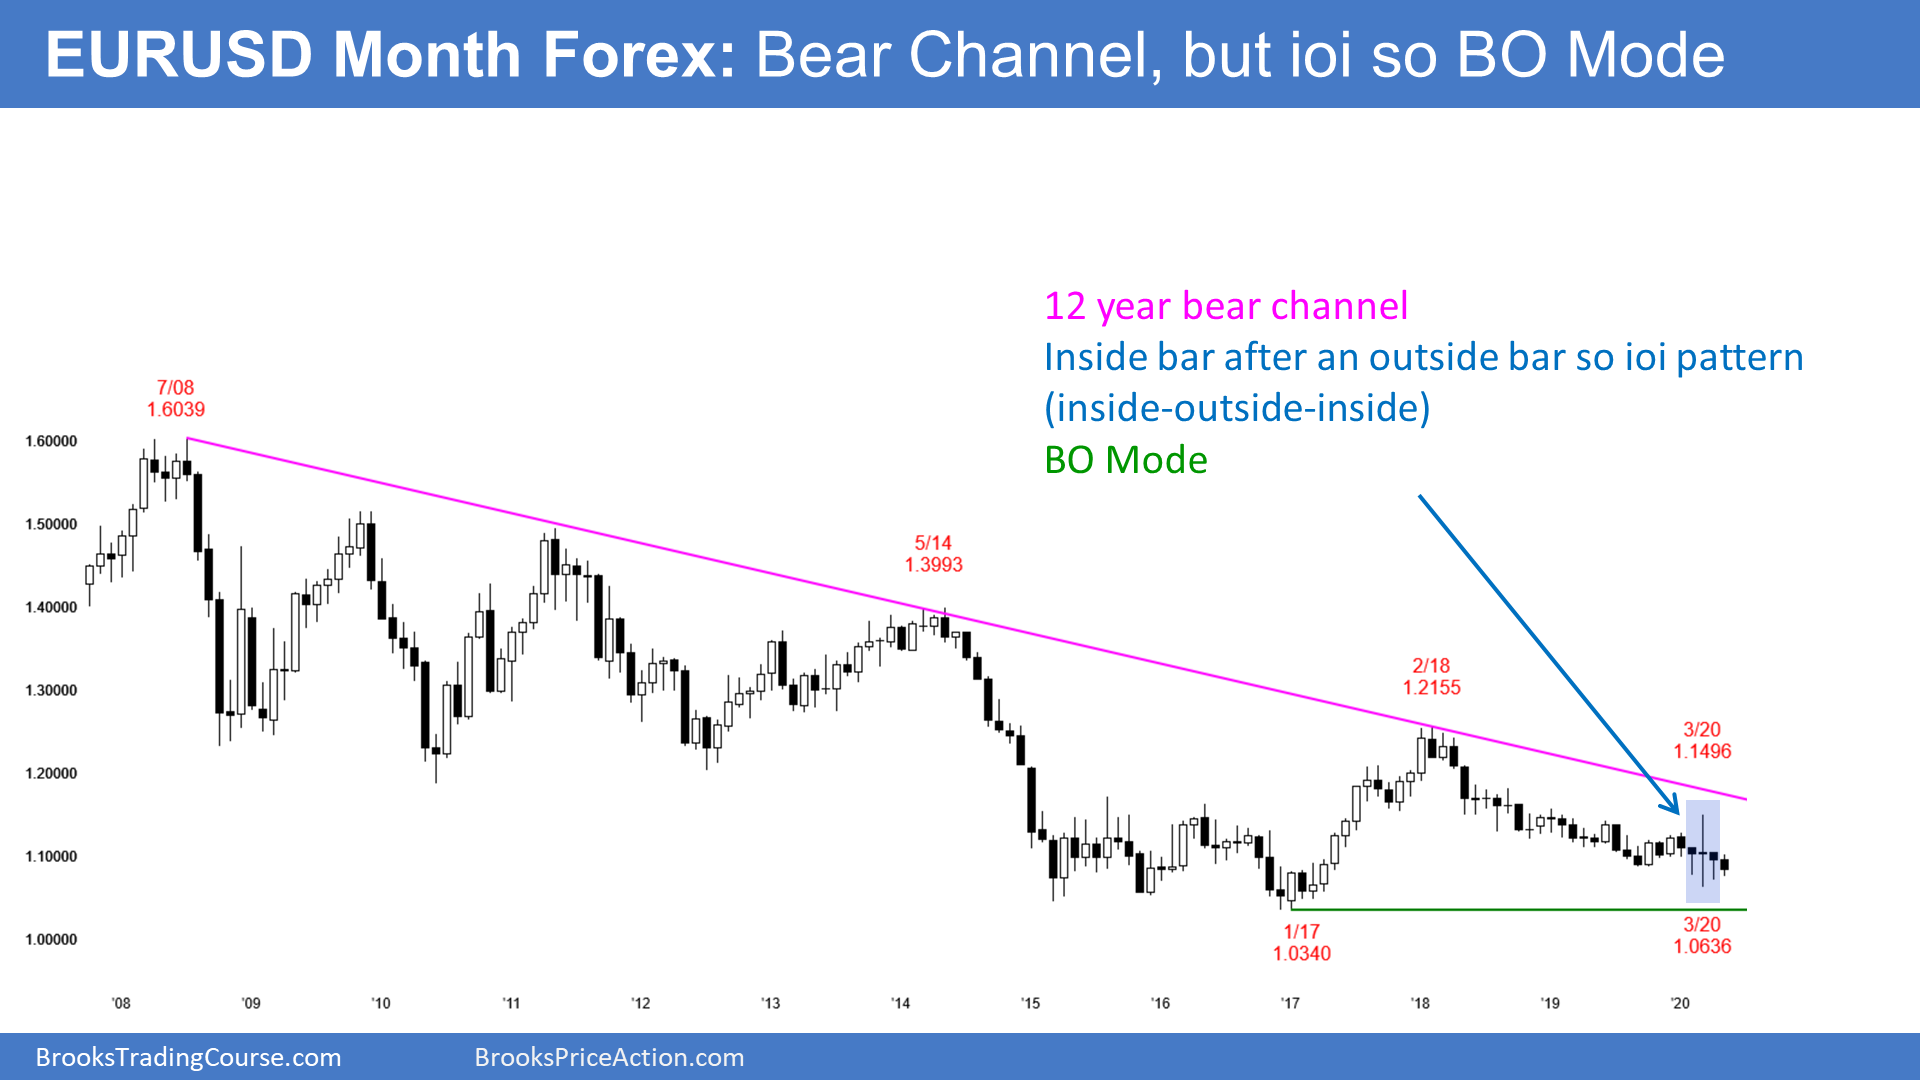
While the weekly chart is in a nested trading range, the monthly chart has been in a bear channel for 2 years. March was a big outside candlestick and April was an inside bar. This is an ioi pattern. Since that is a Breakout Mode pattern, April is both a buy and sell signal bar.
All 3 bars in the ioi had bear bodies and the the bear channel is holding below the 20 month EMA. This makes a bear breakout slightly more likely than a bull breakout. But with the 3 past months all having prominent tails below, this is a weak sell setup. There is a 50% chance that there will be more buyers than sellers below April’s low.
The bears want the bear channel to continue to below the January 2017 low. That was the start of a strong yearlong rally and it is therefore support. They then want the EUR/USD to continue down to par (1.0).
The EUR/USD should continue at least a little lower because there is no sign of a bottom. But because it is just above support, traders will buy if there is a strong reversal up on the monthly chart.
The Covid-19 Pandemic
Number of projected deaths is misleading
If you listen to Dr. Birx, she says that her worst case projection for U.S. deaths from Covid-19 is 240,000. Now, how is it that Dr. Brooks (me, I got my M.D. degree from the University of Chicago) still says that the number will be more like 500,000 to 2 million? Why do I continue to ignore the experts?
It is because Dr. Birx rarely completes her sentence. The part that she usually leaves of is “by August 1.” Her defense is that the models that project the number of deaths do not extend out more than 3 months.
That is a weak defense because she is misleading the public. She and Fauci will not lie, but they are being watched carefully by the political wing of the White House. They are not free to tell the whole truth because they will get fired.
It is important to note that their influence in the decision process is good. They are afraid that if they get fired, those good things might not continue. That puts them in a moral bind, and I think they are making the best choice.
What will the final total of U.S. deaths be?
Dr. Birx never talks about what the final total number of deaths will be, but to me, that is the most important number. In May of 1942, it would have been nice to know what the number of expected American deaths in World War II would be as of August 1, 1942. But at this point, who cares? All that matters now is that by the time the war ended, 400,000 Americans lost their lives.
In 3 years when the pandemic is behind us, will anyone ask how about the number of dead Americans as of August 1, 2020? That is ridiculous. And it is ridiculous that the media is not calling out Dr. Birx or Dr. Fauci over their claim that 240,000 deaths is the worst case scenario.
You must complete the sentence. The worst case is 240,000 deaths… by August 1. That does not tell us how many Americans will be dead by the time there is a vaccine next year or once the pandemic has ended. I still think that Dr. Brooks has it right. Whatever number the media reports is wrong because it based on models that only look 3 months out.
How many Americans will actually die?
I mentioned last week that most Americans are more concerned about the number of deaths than about the economy. Whatever decision we make will be a trade off.
No one wants 38,000 Americans to die every year from automobile accidents. Yet, that’s what happens. We could always lower the speed limit to 20 miles an hour. Then maybe 5,000 people will die. But the majority of Americans would rather have the 38,000 dead.
We could raise the speed limit to 120 miles per hour. That might result in 100,000 dead. The lawmakers had to pick some number, knowing that they were also choosing what an acceptable number of deaths would be.
This the same thing with Covid-19. There is a vocal minority who refuse to live under any restrictions. Even if it is only 30%, it is enough to make sure that the pandemic will infect 30 – 70% of the country. If 30% get infected, that is 100 million people. A 1% death rate means 1 million dead Americans.
If the death rate ends up at 2% and 70% get infected, then 4 million people will die. I have been saying 500,000 to 1 million because I think that will be the final total.
What is the R-factor?
I have talked several times about how many people one infected person will infect. That number is called R0 (pronounced R-naught, and usually called the R-factor). The current R-factor for coronavirus is between 2 and 3. That means that each person will infect 2 to 3 more people.
But what happens once 99.99% of the population gets infected or immunized? Then the R-factor drops to zero. This is because it will be impossible for an infected person to come into contact with someone who is not immune. That is “herd immunity.” Herd refers to the population of the country. Once enough people get infected, the R-factor drops.
I wrote last week that once it falls below 1, the disease eventually goes away. This is because each group of 10 infected people (or any number) is replaced by a smaller group 2 weeks later. Over time, the groups continue to get smaller until it is unlikely that an infected person will come in contact with an uninfected or unvaccinated person. There will then be no new infections and the pandemic will be over.
When does herd immunity exist?
Immunity means that a person has antibodies in his blood that will attach to the virus and prevent it from entering, infecting, and killing cells. If it cannot enter cells, it cannot multiply, and other immune cells destroy the virus particles floating around in the blood stream.
The more contagious a virus is, the higher percentage of the population needs immunity before the pandemic ends. You might have heard that 70% is the number for Covid-19.
If 70% of the population is immune to the coronavirus, there will be herd immunity. Herd immunity means that the R-factor will be less that one. Once that happens, the number of cases will eventually fall to a low enough number to no longer be a major public health hazard.
The math of the R-factor
What happens once 70% of people are immune? Then when an infected person encounters people in next 2 weeks, only 30% of them can get sick since 70% are immune.
Because only 30% of exposed people can get sick, the R-factor will only be 30% of what is was. Thirty percent of an R-factor of 3 is 0.9, which is less than 1. An R-factor of less than 1 results in the total number of infections going down and ending the pandemic. That is why scientists say that herd immunity for the coronavirus only comes when 70% of the population has antibodies and cannot get infected.
Incidentally, measles has the highest R-factor of most common viruses. It is 12. If a contagious person is in a population of unimmunized people, he will on average infect 12 people. It is so contagious that the air in a room can infect someone 2 hours after a measles patient leaves. What is herd immunity for measles? For an R-factor of 12, herd immunity requires 95% of the population to be immune.
That is why it is so morally wrong for parents to not get their kids immunized for measles. If only 5% refuse, then measles remains in the population and babies not yet immunized can get it and die.
Don’t blame the parents for not getting their babies immunized shortly after birth. A baby’s immune system is not sufficiently mature to create enough antibodies to provide immunity until he is 1 year old.
Monthly S&P500 Emini futures chart:
High 1 bull flag, but in 2 1/2 year trading range
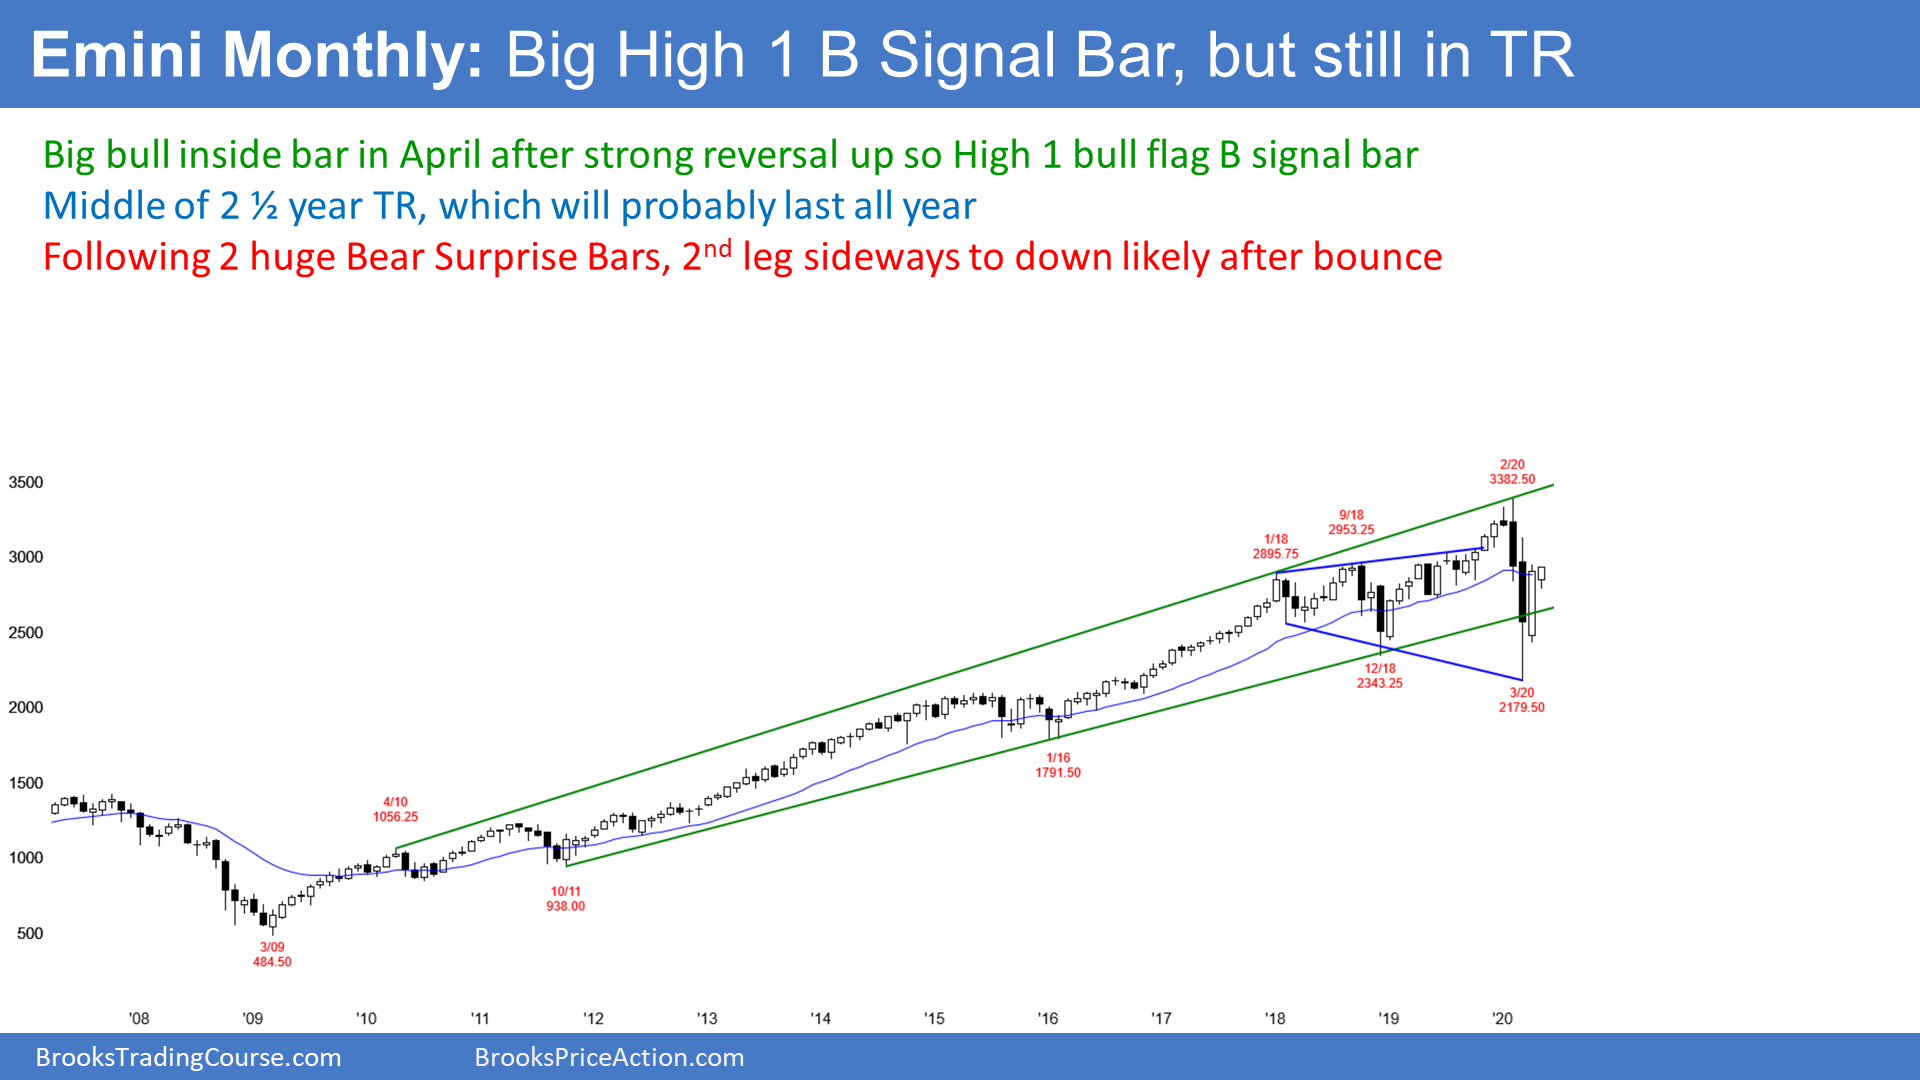
The monthly S&P500 Emini futures chart formed a big bull inside bar in April and it closed near its high. It is a buy signal bar for a 2 bar (month) pullback in an 11 year bull trend.
May is currently a bull bar closing on its high. It should break above the April high within the next couple of weeks. That would trigger the High 1 bull flag buy signal on the monthly chart.
It is important to note that February and March formed a Bear Surprise. Therefore, there is a 70% chance that the Emini will have a 2nd leg sideways to down before making a new all-time high.
When there is a bear surprise, about 20% of the time the pullback (rally) goes above the top of the Bear Surprise before there is a 2nd leg down. But as I said, there is currently only a 30% chance that the 7 week rally will make a new high before there is a pullback.
And even if it does, there would still be a 70% chance of a 2nd leg sideways to down. Consequently, the odds are against a strong resumption up in the 11 year bull trend without the monthly chart going sideways for at least a few months.
Even if the Emini goes sideways for a few months, traders will still believe that the 2 1/2 year trading range is more likely to continue than it is for the bull trend to resume. They think that the upside potential is small over then next several months.
Weekly S&P500 Emini futures chart:
Failed top is now buy signal
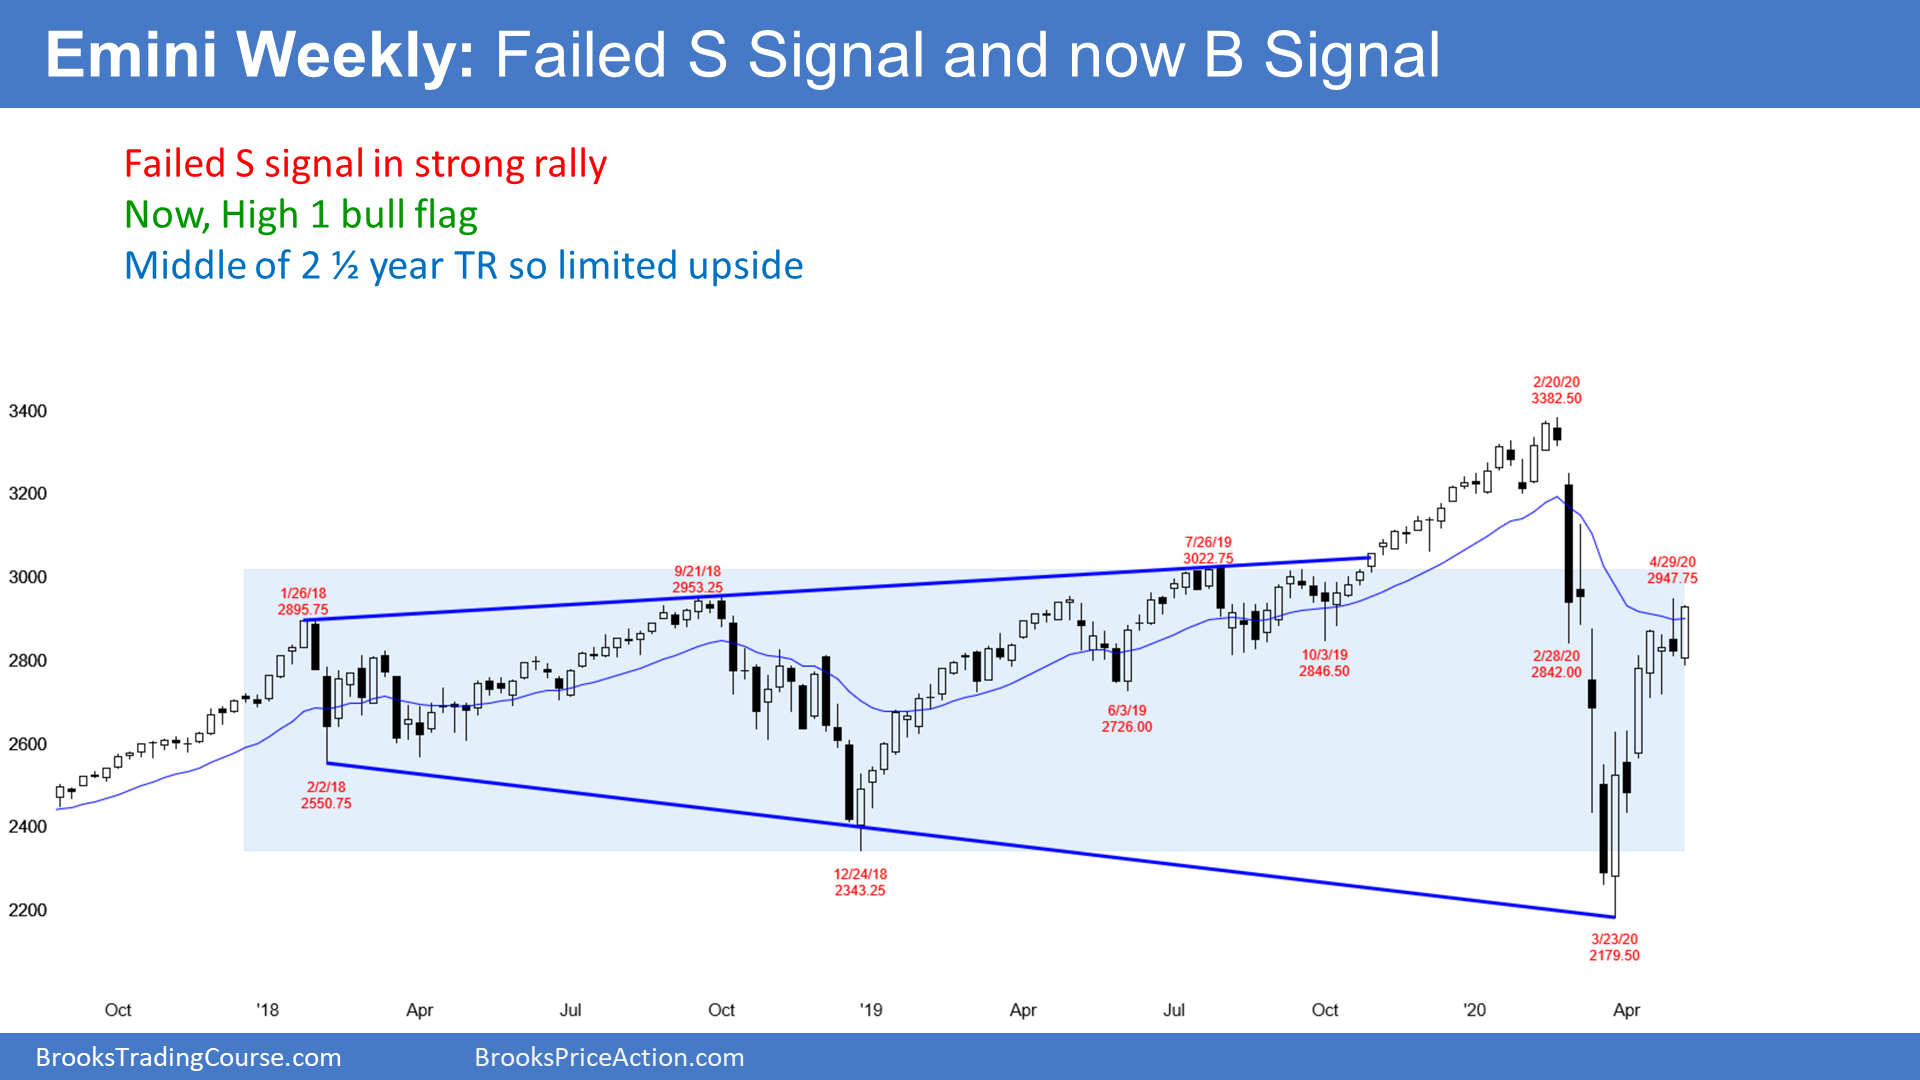
The weekly S&P500 Emini futures chart formed a sell signal bar last week after poking above the 20 week EMA. This week went below last week’s low. That triggered the sell signal.
However, for 6 weeks, traders bought above the low of the prior week. This week, the bulls finally had an opportunity to buy below the low of the prior week. They bought aggressively and this week closed on its high. This week is now a High 1 bull flag buy signal bar for next week.
It is important to note that the 2 month selloff was incredibly strong. That makes it unlikely that this rally will break above the February high without pulling back for several weeks along the way.
The 6 week bull microchannel is unsustainable and climactic. The 2 recent dojis are a sign that the trend is becoming more 2 sided. Consequently, traders should expect a 2 – 3 week pullback to begin in May or June. The longer the rally lasts, the longer the pullback will be.
But the reversal up has been exceptionally strong. Traders believe that the Emini should hold above the March low for the remainder of the year.
Trading range for the remainder of 2020
What’s left? If the Emini can’t get above the high or below the low of the 2 1/2 year trading range, that trading range will continue for the remainder of the year. The bottom of the range might be around the December 2018 low below 2400 and the top might be around the March 3 lower high on the daily chart. That is just above 3100.
Over the next few months, the Emini will probably trade in a relatively tight range. It has been sideways between 2700 and 3000 for a month. It could continue like this for another month or more.
However, at some point in the next few months, it should retrace about half of the 7 week rally. That means traders expect a pullback to between 2500 and 2600 in May or June. Traders believe that the upside from here is not great. If a market cannot go one way, it typically tries the other way. Therefore, since a new high from this rally is not likely, traders expect the Emini to trade down soon
Daily S&P500 Emini futures chart:
Likely failed nested wedge top
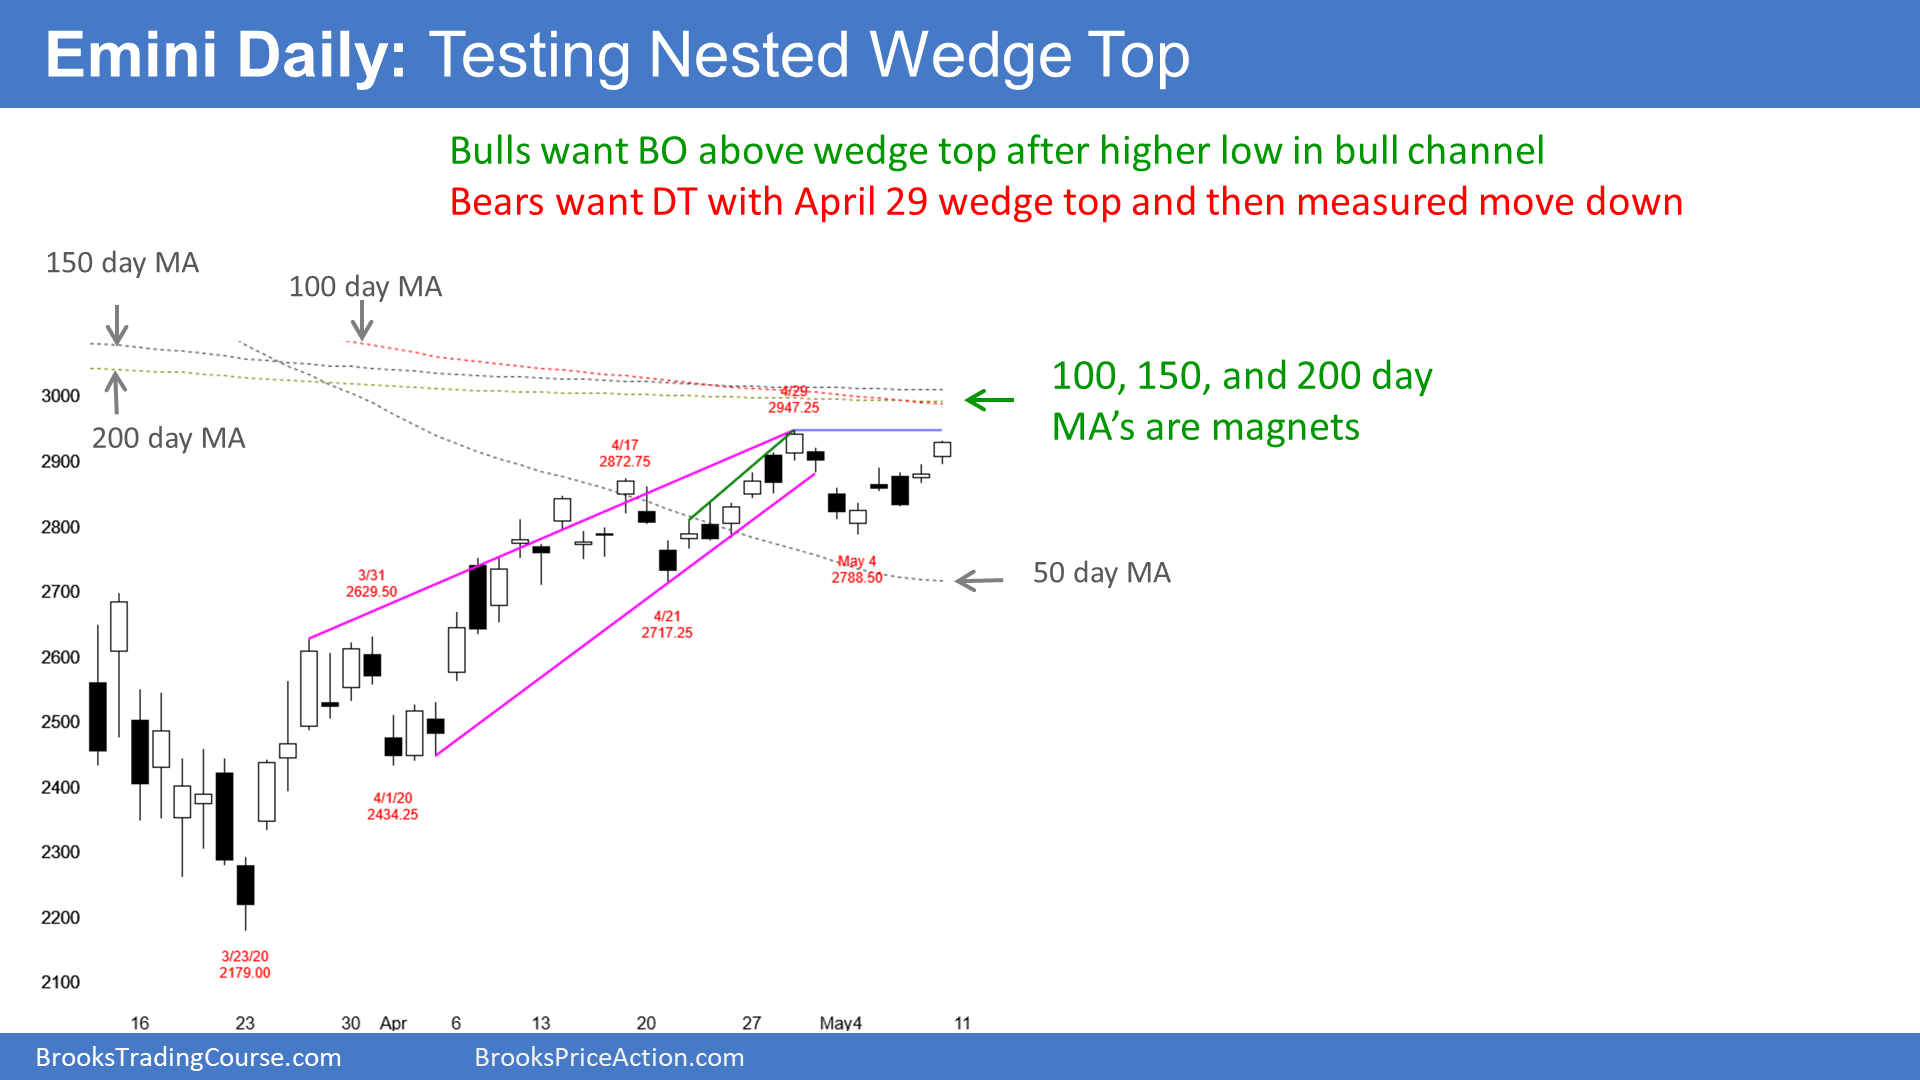
The S&P500 Emini futures market reversed down last week from a wedge top on the daily chart. The 3rd leg up in the wedge was a micro wedge. That means that it is a wedge on a smaller time frame, like the 60 minute chart. There is therefore a nested wedge buy climax on the daily chart. A nested pattern has a higher probability of leading to a reversal.
When a wedge top or any buy climax reverses, traders expect at least a couple legs sideways to down. The selloff typically reaches at least to the bottom of the pullback from the 2nd leg up in the wedge. That is the April 21 low of 2717.25.
It usually continues down to around the bottom of the 1st pullback. That is the April 1 low of 2434.25. However, that target it probably too far down for the reversal down from this top to reach it. But, the Emini might get there later in the year.
As I said, traders expect at least a couple legs down. That means there is a bounce at some point. It forms a lower high and then there is a 2nd leg down. Traders are wondering if this week formed the lower high. It might have, but the monthly and weekly charts make traders believe that the Emini will trade higher.
This wedge is also a tight bull channel
When a wedge top is a tight bull channel, about half of the time, the 1st reversal down will fail. This week’s rally was strong. The April high is the top of the monthly buy signal bar. I mentioned above that the weekly chart has a buy signal. There are 3 moving averages (100, 150, and 200 day) just above the April high. All of these factors make it likely that the Emini will go above the top of the wedge before reversing down.
Once there is a reversal down, the pullback from the 1st leg down is a lower high major trend reversal. It often also is a right shoulder of a head and shoulders top.
Another guideline for the extent of the selloff from a wedge top or buy climax is that it usually has about half as many bars as there were in the wedge. The rally lasted 6 weeks and therefore I have been saying that the reversal down could be 2 – 3 weeks. It could be more, but not less. The longer the rally lasts, the longer the pullback will likely be.
What happens if the Emini breaks above the April high?
The top of the wedge on the daily chart is the April high. Remember, April is a buy signal bar on the monthly chart. The monthly bulls want the buy signal to trigger. They need the Emini to go above the April high. As I wrote above, if it does, traders do not expect the rally to continue up to the February high.
If next week breaks above the top of the wedge, then traders will conclude that this wedge top on the daily chart has failed. They will then look for another pattern.
When the Emini breaks above the top of a wedge, in general, there is a 50% chance of another reversal down and a 50% chance of a strong breakout with at least a couple legs up.
This depends on context. The daily chart is now overbought after a huge bear trend. In this case, there is at least a 60% chance that a break above the April high will reverse down again within the next couple of weeks.
Traders will then renumber the legs of the wedge. The old 2nd leg was strong and traders will then call it the new 1st leg. That is the April 17 high. The break above the April high will be the 3rd leg. Traders would again look for a reversal down for several weeks.
What to expect next week
The Emini will probably go above the April high within a couple weeks. This should happen early next week. That will trigger the buy signals on the weekly and monthly charts. It will also run the stops of the bears who shorted the wedge top.
It should also reach that cluster of moving averages around the 3,000 Big Round Number. The rally might continue up to the March 3 start of the parabolic wedge selloff.
But, it should fail between 3,000 and 3,125. There is only a 30% chance that it will continue directly up to a new high.
The longer it lasts, the deeper and longer the reversal down will be. At the moment, once there is a reversal, it will probably fall to below the March 31 high. That was the breakout point of the 2nd leg up.
There is currently a gap between the April 21 pullback and that breakout point. Since the Emini has been in a trading range for 2 1/2 years and gaps in trading ranges usually close, the Emini should fall to below 2600 within the next couple months.
