Investing.com’s stocks of the week
Pre-Open market analysis
Friday was a bear bar and therefore a sell signal bar for today. There is a parabolic wedge buy climax on the daily chart. It is at the resistance of the top of the 2 month bull channel and the 3250 Big Round Number.
The bears want this year to do the opposite of last Christmas. However, this week is also the end of a very strong decade. Consequently, the odds are against a big selloff from here. The bears will probably need at least a micro double top before they can get more than a 1 – 2 week pullback.
Since the bulls have been strongly in control for a decade, they are trying to get the decade to close at a new high. The current rally is strong enough so that the Emini will probably be sideways to up through the end of the year (tomorrow).
Was Friday’s selloff strong enough to have a 2nd leg down today? Will some bulls take profits just before the end of the year? Both are possible, but the downside risk is currently small.
Overnight Emini Globex trading
The Emini is up 4 points in the Globex session. The bulls will try to prevent today from trading below Friday’s low. They do not want the sell signal to trigger on the daily chart.
Because the bull trend is so strong on the daily chart, there might be more buyers than sellers below Friday’s low. Therefore, even if the sell signal triggers, traders will watch for a possible reversal up from below Friday’s low.
It is important to remember that the bulls have been strong for a decade and for a year. The odds are that they will be able to maintain that strength for the remaining 2 days of the decade. They do not need a big rally. They will be satisfied with a quiet, sideways finish to the decade.
Because of the traditional holiday lack of energy, the odds favor a lot of time in tight trading ranges today and tomorrow. However, there will still probably be at least one brief sharp move up or down, like on Thursday and Friday.
Friday’s setups

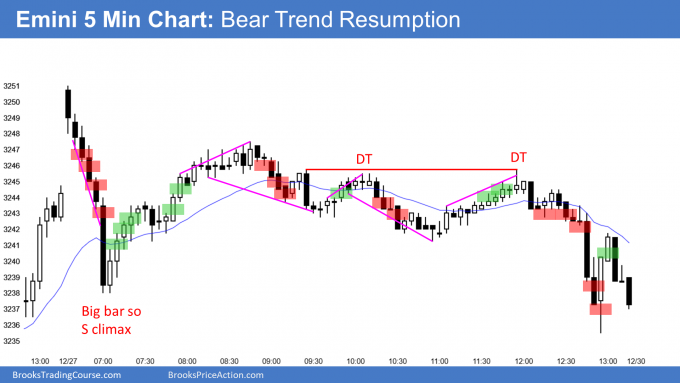
Here are several reasonable stop entry setups from Friday. I show each buy entry with a green rectangle and each sell entry with a red rectangle. I rarely also show limit order entries and entries on the close of bars. Buyers of the Brooks Trading Course and Encyclopedia of Chart Patterns have access to a much more detailed explanation of the swing trades for each day.
My goal with these charts is to present an Always In perspective. If a trader was trying to be Always In or nearly Always In a position all day, and he was not currently in the market, these entries would be logical times for him to enter.
