Pre-Open Market Analysis
The Emini S&P 500 made another all-time high yesterday. However, yesterday was also another small trading range day that traded around the 3200 Big Round Number.
Is the Emini stalling here because of the impeachment? Traders don’t think that way, and it is better to ignore the news. Just trade based on the price action, which is the result of the cumulative votes of anyone in the market who matters.
Because the Emini is stalling at resistance, it might pull back for a day or two. But since the bulls want the year to close on its high and the bull trend is strong, the odds still favor sideways to up through December.
If today gaps down, the bears will have a 2-day island top. An island top is a minor reversal, but traders know that it could lead to a 2 – 3 day pullback. If there is a gap down, the bulls will try to close it early today. If there is an early rally after a gap down, the bears will look for it to fail and form an early high of the day.
It is important to see that the Emini is stalling at the resistance of the 3200 Big Round Number. That slightly increases the chance of a big trend day up or down. But with the unusually tight trading ranges of the past 2 days, day traders know that the odds favor more trading range price action again today. If there is a trend, down is more likely because of the buy climax over the past 3 weeks.
Overnight Emini Globex Trading
The Emini is up 3 points in the Globex session. It will therefore probably again be around the 3200 magnet on the open. It could stay there all day, like it has done for 2 days.The bears want either a gap down or a strong selloff below yesterday’s low. If they get either, they could get a bear trend day today.The 2 day trading range is a bull flag. The bulls therefore want a breakout above and then a bull trend.After 2 days of tight trading range price action, day traders know that the odds favor more sideways trading again today.Yesterday’s Setups

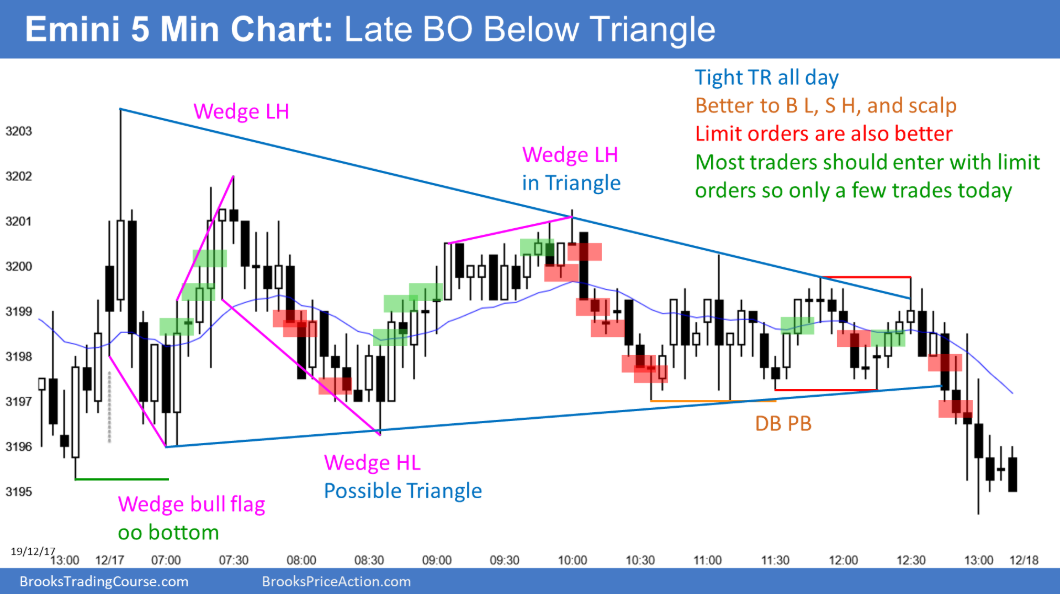
Here are several reasonable stop entry setups from yesterday. I show each buy entry with a green rectangle and each sell entry with a red rectangle. I rarely also show limit order entries and entries on the close of bars.
My goal with these charts is to present an Always In perspective. If a trader was trying to be Always In or nearly Always In a position all day, and he was not currently in the market, these entries would be logical times for him to enter.
