Investing.com’s stocks of the week
Pre-Open Market Analysis
After 2 buy climax days, yesterday was likely to have a lot of trading range price action. The Emini S&P 500 rallied for a few hours and then reversed down below the open. Yesterday is therefore a sell signal bar for today. But after last week’s 2 strong bull days, there will probably be more buyers than sellers below yesterday’s low.
The Emini oscillated around the August ledge top today. That means it is still important. It might oscillate more around it for a few days. However, the odds favor at least a small 2nd leg up after last week’s bear trap and strong reversal up.
Overnight Emini Globex Trading
The Emini is down 18 points in the Globex session. Today will probably gap down. Since Friday gapped up, there would then be a 2-day island top after last week’s 2-day island bottom. Island tops and bottoms are minor reversal patterns. This is especially true when they come in the middle of a trading range, like the one on the daily chart.With all of the trading range price action on the daily chart, day traders expect continued trading range price action on the 5-minute chart. That means that there will likely be at least one swing up and one swing down today. Also, there is an increased chance of several swings and a trading range day.Yesterday’s Setups

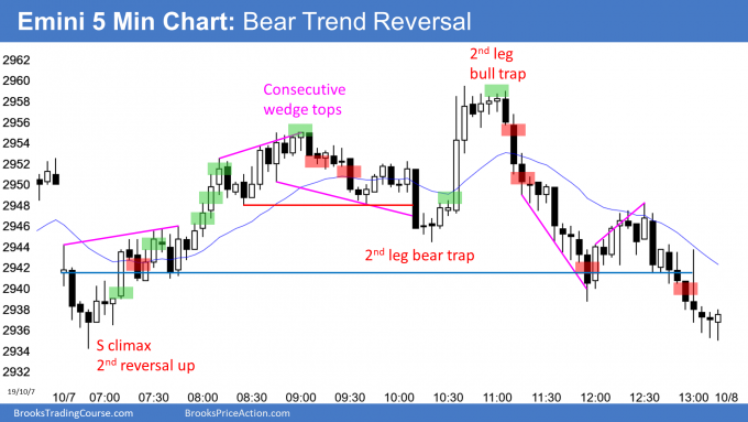
Here are several reasonable stop entry setups from yesterday. I show each buy entry with a green rectangle and each sell entry with a red rectangle. I rarely also show limit order entries and entries on the close of bars. Buyers of the Brooks Trading Course and Encyclopedia of Chart Patterns have access to a much more detailed explanation of the swing trades for each day.
My goal with these charts is to present an Always In perspective. If a trader was trying to be Always In or nearly Always In a position all day, and he was not currently in the market, these entries would be logical times for him to enter.
