Who is Kevin Hassett? Wolfe looks at the Trump ally tipped to become Fed Chair.
Pre-Open Market Analysis
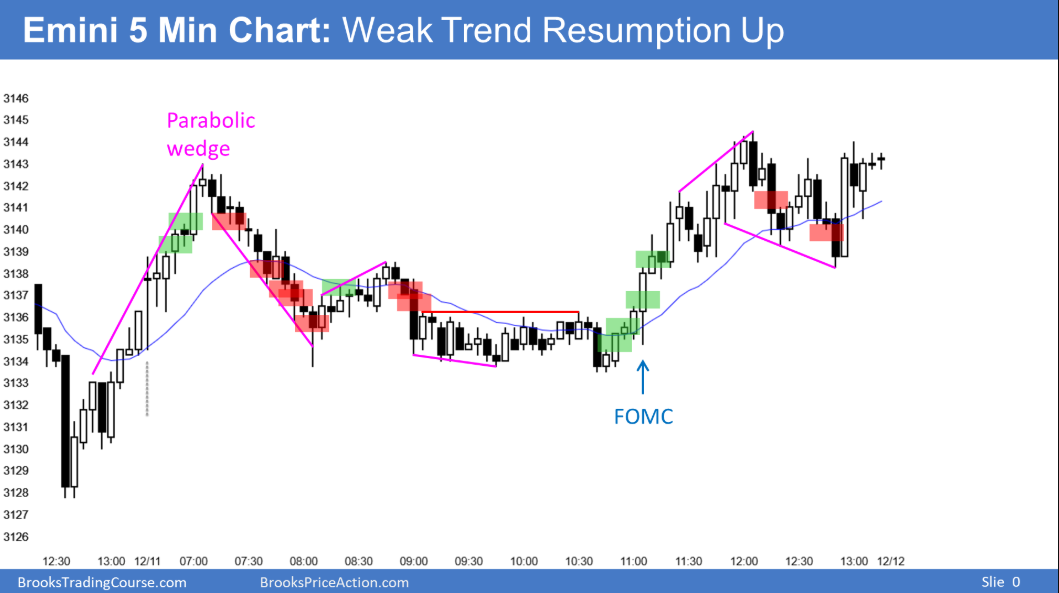
Yesterday’s FOMC report was a non-event. The Emini has been sideways for 4 days. That increases the chance of more sideways trading again today.
Last week’s candlestick is a High 1 buy signal bar on the weekly chart. The bulls want to trigger the buy signal and then have the year to close at a new high.
However, the bears hope for a reversal down from a double top with the high of 2 weeks ago. Since the bull trend is strong on the weekly chart, the bulls have a higher probability of success. This is true even if the bears first get a selloff to around last week’s low. Yesterday is not giving day traders a sign that today will be the start of the breakout or of a reversal down.
Overnight Emini Globex Trading
The Emini is down 5 points in the Globex session. Traders are deciding if the 7 day rally will continue to trend up for the rest of the year. The bears want a double top with the high from 2 weeks ago and then a trend down.But the past 7 days have all been small and had lots of trading range price action. That means the odds are against a strong trend day today. Since markets have inertia, day traders will expect at least one reversal again today. Because the Emini is at a critical price, if there is a trend up or down, it could be relentless, but a trading range is more likely.Yesterday’s Setups

Here are several reasonable stop entry setups from yesterday. I show each buy entry with a green rectangle and each sell entry with a red rectangle. I rarely also show limit order entries and entries on the close of bars. Buyers of the Brooks Trading Course and Encyclopedia of Chart Patterns have access to a much more detailed explanation of the swing trades for each day.
My goal with these charts is to present an Always In perspective. If a trader was trying to be Always In or nearly Always In a position all day, and he was not currently in the market, these entries would be logical times for him to enter.
