Investing.com’s stocks of the week
Pre-Open Market Analysis
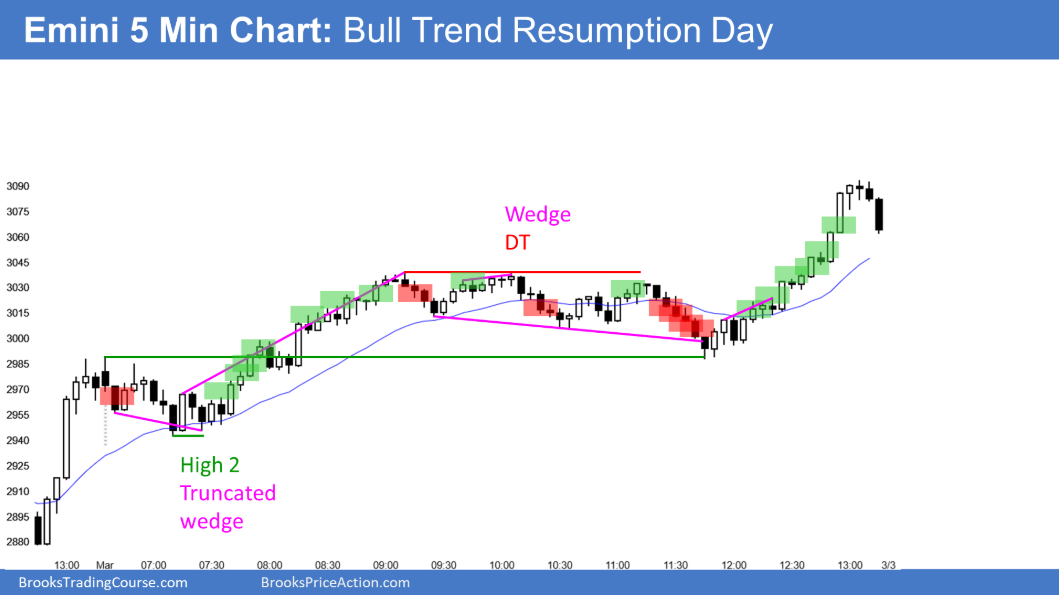
As I said was likely, yesterday was a bull trend day. Since last week’s collapse was so severe, there will probably be more Emini S&P 500 short covering today or later this week. However, there is currently only a 30% chance that this rally will be a repeat of the January 2019 reversal. That rally went straight up for 4 months with only small pullbacks.
If there is surprisingly bad news about coronavirus, the bears will get another leg down. There is still a 30% chance of a 30 – 50% correction.
However, there were no significant surprises for a few days. Traders are wondering if they drove the market down further than necessary to compensate for the coronavirus.
When there is uncertainty, the market usually goes sideways. While there is a bullish bias this week, traders want at least a few weeks without terrible coronavirus news before they will chase a rally to a new high.
That is not likely to happen for at least a month or two. It will only happen if the pandemic is contained. Since I think that is unlikely, I suspect a new high is many months away.
Overnight Emini Globex Trading
The Emini is up 12 points in the Globex session. After an extreme buy climax day like yesterday, there is only a 25% chance of another strong bull trend day lasting all day.Furthermore, there is a 75% chance of at least a couple hours of sideways to down trading starting by the end of the 2nd hour.Yesterday spent several hours in a trading range just above the 3000 Big Round Number and the 60-minute EMA. Both are magnets below for today and tomorrow.The Emini has been in a tight trading range overnight. There is an increased chance of a lot of trading range price action after a huge trend day. The overnight range might continue all day. If there is a bear breakout, a measured move down would be in yesterday’s range just above 3000.
Yesterday’s Setups

Here are several reasonable stop entry setups from yesterday. I show each buy entry with a green rectangle and each sell entry with a red rectangle. I rarely also show limit order entries and entries on the close of bars. Buyers of the Brooks Trading Course and Encyclopedia of Chart Patterns have access to a much more detailed explanation of the swing trades for each day.
My goal with these charts is to present an Always In perspective. If a trader was trying to be Always In or nearly Always In a position all day, and he was not currently in the market, these entries would be logical times for him to enter.
If the risk is too big for your account, you should wait for trades with less risk or trade an alternative market like the Micro Emini.
