Pre-Open Market Analysis
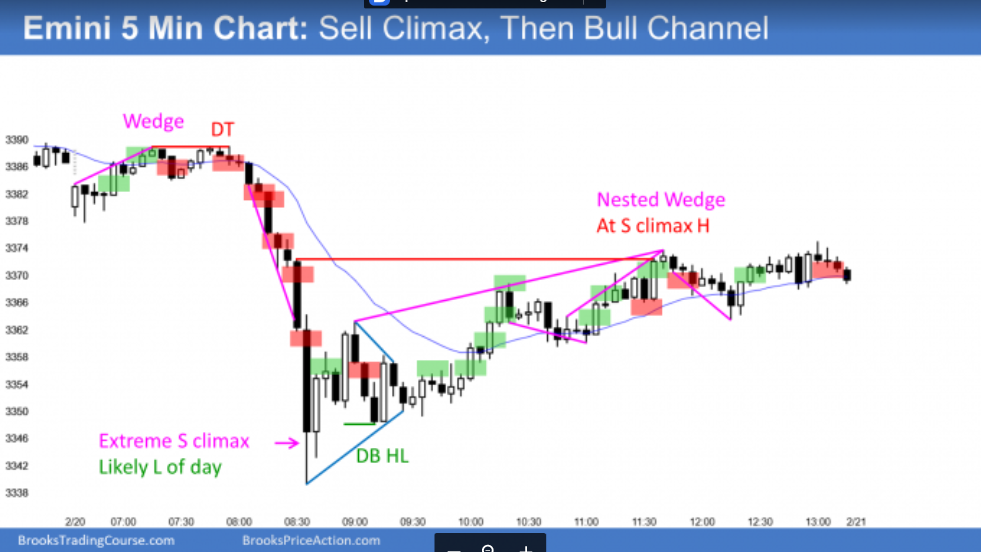
The Emini S&P 500yesterday had a surprisingly strong selloff. After the sell climax, it rallied in a bull channel and closed around the open of the week. This week currently a doji bar on the weekly chart.
Since today is Friday, weekly support and resistance are important. The 2 nearest targets are the open and high of the week. If the Emini is within 10 points of either in the final hour, it might get drawn to the magnet.
I have mentioned many times over the past 2 weeks that the 3-week rally was probably a leg in a trading range that began at Christmas. Furthermore, I have been saying that there would probably be a test down to the February 10 low within a couple weeks. That was the bottom of the most recent leg up. Yesterday is a good candidate for the start of the test down.
Finally, I have said several times that there is a 50% chance that the Emini would fall to the January low by the end of March. That is still true.
But since the rally is probably a leg in a trading range, the selloff will be a bear leg in the range. Legs in trading ranges rarely go straight up or down. There is confusion, which means traders take quick profits. This results in pullbacks every few days. If the bear leg has begun, the Emini might go sideways for several days before it falls much further.
Also, despite yesterday’s big selloff, the reversal up was big. That is consistent with the trading range price action over the past 7 days. It increases the chance that today will also have at least one swing up and one swing down.
Overnight Emini Globex Trading
The Emini is down 12 points in the Globex session. Day traders are aware that yesterday’s collapse was a surprise. The bulls hope that it was a bear trap and that the bull trend resumes today or early next week.But is was such a big surprise that it more likely will have at least a small 2nd leg sideways to down withing a few days. Furthermore, the February rally is probably a bull leg in a trading range that began around Christmas. Day traders have to consider the possibility that yesterday was the start of a bear leg in a 2 month trading range. This increases the chance of several bear trend days over the next couple weeks.Today is Friday. The most important price is the open of the week. Despite yesterday’s crash on the 5 minute chart to 30 points below the week’s open, the rally got back above the week’s open. Since yesterday was a Big Down, Big Up day, there is Big Confusion. That usually results in a trading range. It therefore increases the chance of a trading range day today. If so, today might get drawn to the open of the week in the final hour.
Yesterday’s Setups

Here are several reasonable stop entry setups from yesterday. I show each buy entry with a green rectangle and each sell entry with a red rectangle. I rarely also show limit order entries and entries on the close of bars. Buyers of the Brooks Trading Course and Encyclopedia of Chart Patterns have access to a much more detailed explanation of the swing trades for each day.
My goal with these charts is to present an Always In perspective. If a trader was trying to be Always In or nearly Always In a position all day, and he was not currently in the market, these entries would be logical times for him to enter.
If the risk is too big for your account, you should wait for trades with less risk or trade an alternative market like the Micro Emini.
