Why the U.S. dollar still reigns supreme
Pre-Open Market Analysis
The Emini gapped up yesterday and formed a 1 day island bottom. Last week was a bull bar on the weekly chart and therefore a bad sell signal bar. Some bulls theoretically bought below its low and scaled in lower. They were confident that any selloff would come back to last week’s low. It did yesterday.
The bulls are hoping that the rally will continue up to the all-time high. However, the selloff was strong enough to make at least a 2nd leg sideways to down likely.
Also, the Emini is back in the 6-day tight trading range from 2 weeks ago. Furthermore, the past 2 bull days had prominent tails on top on the daily chart. It therefore might go sideways here for a few days. Additionally, the Emini might go sideways into the December 15 China tariff announcement.
The 2-day rally was not particularly strong on the 5 minute chart. It looks more like a bull leg in a trading range than a resumption of a bull trend. There was a lot of trading range price action during both days. Day traders will expect more trading range price action again today.
Overnight Emini Globex Trading
The Emini is up 10 points in the Globex session. Traders are debating whether the 2-day rally is a resumption of the 2 month bull trend or a pullback in a new bear trend. They might need a few days to decide.The Emini has retraced about half of the selloff. In addition, it’s back to the middle of the range of the past 4 weeks. Finally, there was a lot of trading range price action over the past 2 days. These factors make more sideways trading on the daily chart likely.Additionally, they make more trading range price action on the 5 minute chart likely. Day traders will expect trends to be brief and have bad follow-through. In addition, there should again be many reversals.Yesterday’s Setups

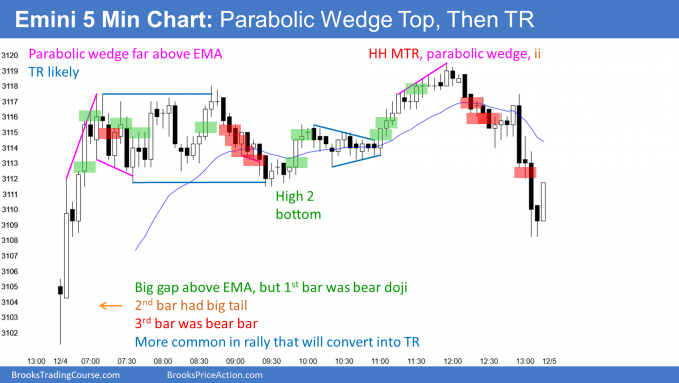
Here are several reasonable stop entry setups from yesterday. I show each buy entry with a green rectangle and each sell entry with a red rectangle. I rarely also show limit order entries and entries on the close of bars. Buyers of the Brooks Trading Course and Encyclopedia of Chart Patterns have access to a much more detailed explanation of the swing trades for each day.
My goal with these charts is to present an Always In perspective. If a trader was trying to be Always In or nearly Always In a position all day, and he was not currently in the market, these entries would be logical times for him to enter.
