Pre-Open Market Analysis
Friday was an outside down day on the daily emini S&P 500 chart. Since it came from the 3rd leg up over the past 2 weeks, the bears are hoping for at least a couple legs down over the next couple weeks.
However, the 3-month rally has been in a tight bull channel. That is a strong bull trend. Traders will bet that every top will fail until one clearly succeeds. Therefore, they view Friday as a pullback in a bull trend instead of the start of a reversal into a bear trend.
Everyone knows that the daily, weekly, and monthly charts are overbought. But buy climaxes often last longer than what seems likely. The bears will probably need at least a double top on the daily chart before they can begin a 2 – 3 week leg down. Alternatively, if there is a big Bear Surprise Bar or 2 – 3 medium size bear bars closing on their lows, traders will look for a 2 – 3 week pullback. Without some sign of strong bears, traders will continue to bet that every reversal will fail within 2 – 3 days.
Overnight Emini Globex Trading
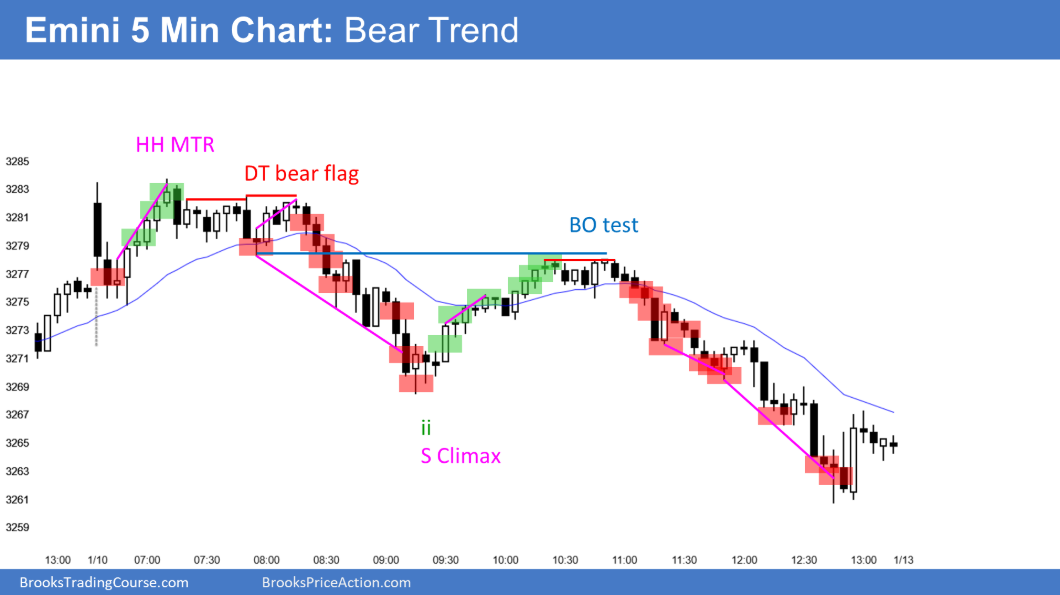
The Emini is up 11 points in the Globex session. There will therefore probably be a big gap up.A big gap usually means that the Emini is far above its average price. Many traders prefer to buy closer to the average price. Once measure of average is the 20 bar EMA. Consequently, a big gap up usually leads to an hour or two of trading range price action.Once the Emini gets closer to the EMA, the bulls look for a double bottom or wedge bottom. When the Emini is in that trading range, the bears will try to create a double top or wedge and then a swing down.Friday’s selloff over the final 3 hours was in a tight bear channel. When that happens, the Emini typically converts into a trading range before it can enter a bull trend. That is an additional reason to expect a Trading Range Open.Most days over the past couple weeks have been big and have had swings up and down. Therefore, even if today is a trading range day, the range will probably be big enough for at least one swing up and one swing down.
Friday’s Setups

Here are several reasonable stop entry setups from yesterday. I show each buy entry with a green rectangle and each sell entry with a red rectangle. I rarely also show limit order entries and entries on the close of bars. Buyers of the Brooks Trading Course and Encyclopedia of Chart Patterns have access to a much more detailed explanation of the swing trades for each day.
My goal with these charts is to present an Always In perspective. If a trader was trying to be Always In or nearly Always In a position all day, and he was not currently in the market, these entries would be logical times for him to enter.
